Understanding ANOVA for Statistical Analysis
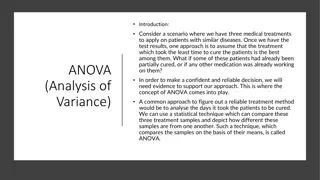
ANOVA (Analysis of Variance) is a powerful statistical method introduced by R.A. Fisher in 1920. It allows for comparison of means and is widely used in social sciences to test hypotheses about differences between multiple means. ANOVA helps avoid the increased risk of Type I errors associated with multiple t-tests, making it a valuable tool in experimental research designs.

Download Presentation

Please find below an Image/Link to download the presentation.
The content on the website is provided AS IS for your information and personal use only. It may not be sold, licensed, or shared on other websites without obtaining consent from the author. If you encounter any issues during the download, it is possible that the publisher has removed the file from their server.
You are allowed to download the files provided on this website for personal or commercial use, subject to the condition that they are used lawfully. All files are the property of their respective owners.
The content on the website is provided AS IS for your information and personal use only. It may not be sold, licensed, or shared on other websites without obtaining consent from the author.
E N D
Presentation Transcript
ANOVA ANOVA
ANOVA is an abbreviation for the name of the method: Analysis of Variance introduced by R A Fisher in 1920. ANOVA is comparison of means.Each possible value of a factor or combination of factor is a treatment. The ANOVA is a powerful and common statistical procedure in the social sciences. It can handle a variety of situations.
Analysis of Variance (ANOVA) ANOVA is used to test hypotheses about differences between two or more means. The t-test can only be used to test differences between two means. When there are more than two means, it is possible to compare each mean with each other mean using t-test. However, conducting multiple t-tests can lead to severe inflation of the type-I error. ANOVA can be used to test differences among several means for significance without increasing the Type I error rate.
Why ANOVA? Widely used in testing of significance of results of test conducting in Agri & Bio Sci. In real life things do not typically result in two groups being compared. Two-sample t-tests are problematic Increasing the risk of a Type I error At .05 level of significance, with 100 comparisons, 5 will show a difference when none exists (experiment wise error) So the more t-tests you run, the greater the risk of a type I error (rejecting the null when there is no difference) ANOVA allows us to see if there are differences between means with an OMNIBUS test
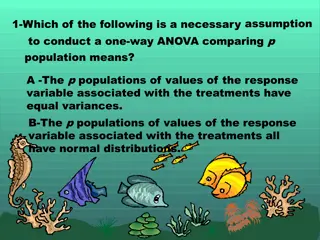
When ANOVA? Data must be experimental If you do not have access to statistical software, an ANOVA can be computed by hand With many experimental designs, the sample sizes must be equal for the various factor level combinations A regression analysis will accomplish the same goal as an ANOVA. ANOVA formulas change from one experimental design to another
Methodology Ho : 1= 2= 3= 4 .. k H1 : Two of the means are not equal Determination of Variance Ratio of Variance (F)= Greater Variance/Lesser Variance F = Variance between the samples/ Variance within the samples F-test calculated value< Table value Meaning thereby the evidence against the null hypothesis is not significant.
Eg. The figures of yield of crop on 12 plots of land for 3 varieties of Rice. Find out whether there is significant difference in the yield of crop of different varieties. Plot Varieties A 1 12 Varieties B 18 Varieties C 10 2 08 12 16 3 16 14 18 4 12 12 20
Table of squares Plot Varieties B A B2 C C2 total A2 144 64 256 144 1 2 3 4 12 8 16 12 48 18 12 14 12 56 324 144 196 144 10 16 18 20 64 100 256 324 400 Total Sum of Squares Squares of sums T-168 SOS=2496 608 808 1080 2304 3136 4096 TSOS=9536 Correction Factor = T2/n Total SOS = Total SOS- Correction factor SOS (between samples) = TSOS/ N- C.F. SOS ( within samples) = TSOS- SOS(between Samples) 168x168/12 =2352 2496-2352 = 144 9536/4-2352 = 32 144-32 = 112
Contd Cont d SOS D.f. Variance Between samples 32 2 16 With in samples 112 9 12.44 Total 144 11 Ratio of Variance (F) = Variance (between samples)/Variance( within samples) = V1/V2 = 16/12.44 F = 1.37 (CalculatedValue) Since table value for 2 and 9 degrees of freedom at 5 % level of significance is 4.26. Thus F value 1.37( calculated value) < 4.26 (table value) so the evidence against the null hypothesis is not significant.
Variance to compare Means We are applying the variance concept to means How do means of different groups compare to the overall mean Do the means vary so greatly from each other that they exceed individual differences within the groups?
Between/Within Groups Variance can be separated into two major components Within groups variability or differences in particular groups (individual differences) Between groups - differences depending what group one is in or what treatment is received Formulas: page 550
Fundamental Concepts You are able to compare MULTIPLE means Between-group variance reflects differences in the way the groups were treated Within-group variance reflects individual differences Null hypothesis: no difference in means Alternative hypothesis: difference in means
Other applications ANOVA for three or more independent variables. One way ANOVA Two way ANOVA Repeated ANOVA


")