Understanding Active Filters for Signal Processing
Dive into the world of active filters used for signal processing, including low-pass, high-pass, and band-pass filters. Explore the characteristics and responses of these filters, along with critical frequencies and bandwidth calculations. Learn how active devices like op-amps combined with passive circuits create effective frequency selectivity in filtering circuits.

Download Presentation

Please find below an Image/Link to download the presentation.
The content on the website is provided AS IS for your information and personal use only. It may not be sold, licensed, or shared on other websites without obtaining consent from the author. Download presentation by click this link. If you encounter any issues during the download, it is possible that the publisher has removed the file from their server.
E N D
Presentation Transcript
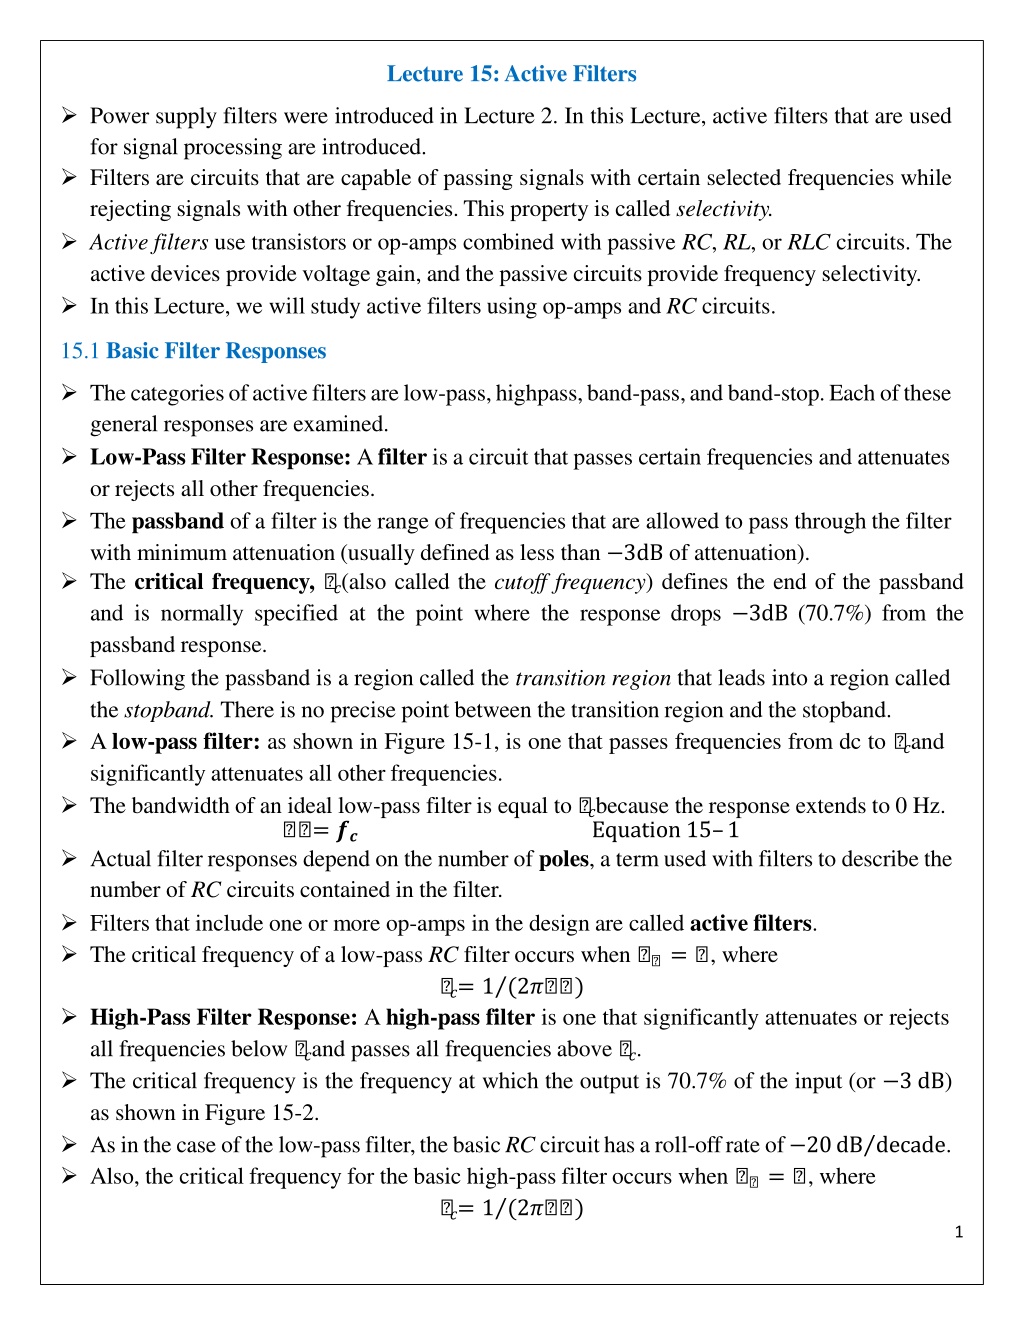
Lecture 15:Active Filters Power supply filters were introduced in Lecture 2. In this Lecture, active filters that are used for signal processing are introduced. Filters are circuits that are capable of passing signals with certain selected frequencies while rejecting signals with other frequencies.This property is called selectivity. Active filters use transistors or op-amps combined with passive RC, RL, or RLC circuits. The active devices provide voltage gain, and the passive circuits provide frequency selectivity. In this Lecture, we will study active filters using op-amps and RC circuits. 15.1 Basic Filter Responses Thecategoriesofactivefiltersarelow-pass,highpass,band-pass,andband-stop.Eachofthese general responses are examined. Low-Pass Filter Response: Afilter is a circuit that passes certain frequencies and attenuates or rejects all other frequencies. The passband of a filter is the range of frequencies that are allowed to pass through the filter with minimum attenuation (usually defined as less than 3dB of attenuation). The critical frequency, ?(also called the cutoff frequency) defines the end of the passband and is normally specified at the point where the response drops 3dB (70.7%) from the passband response. Following the passband is a region called the transition region that leads into a region called the stopband. There is no precise point between the transition region and the stopband. A low-pass filter: as shown in Figure 15-1, is one that passes frequencies from dc to ?and significantly attenuates all other frequencies. The bandwidth of an ideal low-pass filter is equal to ?because the response extends to 0 Hz. = ?? Actual filter responses depend on the number of poles, a term used with filters to describe the number of RC circuits contained in the filter. Filters that include one or more op-amps in the design are called active filters. The critical frequency of a low-pass RC filter occurs when = , where ?= 1 (2? ) High-Pass Filter Response: A high-pass filter is one that significantly attenuates or rejects all frequencies below ?and passes all frequencies above ?. The critical frequency is the frequency at which the output is 70.7% of the input (or 3 dB) as shown in Figure 15-2. As inthecase ofthe low-passfilter,thebasicRC circuithasa roll-offrate of 20dB decade. Also, the critical frequency for the basic high-pass filter occurs when = , where ?= 1 (2? ) Equation 15 1 1
FIGURE 15-1: Low-pass filter responses. FIGURE 15-2: High-pass filter responses. 2
Band-Pass Filter Response: A band-pass filter passes all signals lying within a band between a lower-frequency limit and an upper-frequency limit and essentially rejects all other frequencies that are outside this specified band, as shown in Figure 15-3. The bandwidth ( ) is defined as the difference between the upper critical frequency ( ?2) and the lower critical frequency ( ?1). = ?? ?? Equation 15 2 The critical frequencies are, of course, the points at which the response curve is 70.7% of its maximum. These critical frequencies are also called 3? frequencies. The frequency about which the passband is centered is called the center frequency, 0. ? = ?? ?? Equation 15 3 Quality Factor ( ) of a band-pass filter is the ratio of the center frequency to the bandwidth. = ? Equation 15 4 The value of is an indication of the selectivity of a band-pass filter. The higher the value of Q, the narrower the bandwidth and the better the selectivity for a given value of 0. Band-pass filters are sometimes classified as narrow-band ( > 10) or wide-band ( < 10). The can also be expressed in terms of the damping factor ( ) of the filter as = 1 FIGURE 15-3: General band- pass response curve. EXAMPLE 15-1: A certain band-pass filter has a center frequency of 15 kHz and a bandwidth of 1 kHz. Determine and classify the filter as narrow-band or wide-band. Solution = 0 = 15 kHz 1 kHz = 15 Because > 10, this is a narrow-band filter. 3
Band-Stop Filter Response: Another category of active filter is the band-stop filter, also known as notch, band-reject, or band-elimination filter is shown in Figure 15-4. We can think of the operation as opposite to that of the band-pass filter because frequencies within a certain bandwidth are rejected, and frequencies outside the bandwidth are passed. FIGURE 15-4: General band-stop filter response. 15.2 Filter Response Characteristics Each type of filter response (low-pass, high-pass, band-pass, or band-stop) can be realized by proper selection of certain component values to have either a Butterworth, Chebyshev, or Bessel characteristic. Ageneral comparison of the three response characteristics for a low-pass filter response curve is shown in Figure 15-5. High-pass and band-pass filters can also be designed to have any one of the characteristics. FIGURE 15-5: Comparative plots of three types of filter response characteristics. The Butterworth Characteristic: Filters with the Butterworth response characteristic have a very flat response in the passband, exhibit a roll-off of 20 dB/decade/pole, and are used when all the frequencies in the passband must have the same gain. Each pole in a Butterworth filter causes the output to roll off at a rate of 20 dB/decade. The Chebyshev Characteristic: Filters with the Chebyshev characteristic have ripples or overshoot in the passband and exhibit a faster roll-off per pole than filters with the Butterworth characteristic. 4
The Bessel Characteristic: Filters with the Bessel characteristic are used for filtering pulse waveforms. Their linear phase characteristic results in minimal waveshape distortion. The roll-off rate per pole is slower than for the Butterworth. The Damping Factor ( ): The damping factor determines the filter response characteristic (Butterworth, Chebyshev, or Bessel). To explain the basic concept, a generalized active filter is shown in Figure 15-6. It includes an amplifier, a negative feedback circuit, and a filter section. The amplifier and feedback are connected in a noninverting configuration. The damping factor is determined by the negative feedback circuit and is defined by the following equation: = ( ) Equation 15 5 FIGURE 15-6: General diagram of an active filter. The value of the damping factor required to produce a desired response characteristic depends on the order (number of poles) of the filter. A pole, for our purposes, is simply a circuit with one resistor and one capacitor. The more poles a filter has, the faster its roll-off rate is. To achieve a second-orderButterworthresponse, for example, the damping factor must be 1.414. To implement this damping factor, the feedback resistor ratio must be ( 1 2) = 2 = 2 1.414 = 0.586 This ratio gives the closed-loop gain of the noninverting amplifier portion of the filter, ? (NI), a value of 1.586, derived as follows: ? (NI) = 1 = 1 ( 2 ( 1 + 2)) = (( 1 + 2) 2) = ( 1 2)+ 1 = 0.586+ 1 = 1.586 EXAMPLE 15-2: If resistor 2 in the feedback circuit of an active single-pole filter of the type in Figure 15-6 is 10 k , what value must 1 be to obtaina maximally flat Butterworth response? Solution ( 1 2) = 0.586, 1 = 0.586 2 = 0.586(10 k ) = 5.86 k Using thenearest standard 5percent value of 5.86 k will get very close to the ideal Butterworth response. 5
Critical Frequency and Roll-Off Rate: The critical frequency is determined by the values of the resistors and capacitors in the frequency-selective RC circuit. For a single-pole (first- order) filter, the critical frequency is ?= 1 (2? ) Because of itsmaximally flatresponse,theButterworthcharacteristicis themost widelyused. Table 15-1 lists the roll-off rates, damping factors, and feedback resistor ratios for up to sixth- order Butterworth filters. TABLE 15-1: Values for the Butterworth response. 15.3Active Low-Pass Filters Filters that use op-amps as the active element provide several advantages over passive filters ( , ?, and elements only). The op-amp provides gain, so the signal is not attenuated as it passes through the filter. A Single-Pole Low-Pass filters have a roll-off of 20 dB/decade above the critical frequency, as indicated by the response curve in Figure 15-7. The op-amp in this filter is connected as a noninverting amplifier with the closed-loop voltage gain in the passband set by the values of 1 and 2. ? (? ) = ( ) + Equation 15 6 FIGURE 15-7: Single-pole active low-pass filter and response curve. 6
The Sallen-Key Low-Pass Filter: The Sallen-Key low-pass filter has two poles (second order) and has a 40 dB/decade roll-off. A low-pass version of the Sallen-Key filter is shown in Figure 15-8. There are two low-pass RC circuits that provide a roll-off of 40 dB/decade above the critical frequency (assuming a Butterworth characteristic). The critical frequency for the Sallen-Key filter is ??= ( ( )) Equation 15 7 The component values can be made equal so that = = and = = . In this case, the expression for the critical frequency simplifies to ?= 1 (2? ). FIGURE 15-8: Basic Sallen-Key low-pass filter. EXAMPLE 15-3: Determine the critical frequency of the Sallen-Key low-pass filter in Figure 15-9, and set the value of 1 for an approximate Butterworth response. FIGURE 15-9 Solution Since = = = 1.0 k and = = = 0.022 ?F, 1 1 ?=2? =2?(1.0k )(0.022 ?F)= 7.23 kHz For a Butterworth response, 1 2 = 0.586. 1 = 0.586 2 = 0.586(1.0k ) = 586 k We select a standard value as near as possible to this calculated value. Cascaded Low-Pass Filters: Each additional filter in a cascaded arrangement adds 20 dB to the roll-off rate. A three-pole filter is required to get a third-order low-pass response ( 60 dB/decade). This is done by cascading a two-pole Sallen-Key low-pass filter and a single-pole low-pass filter, 7
as shown in Figure 15-10(a). Figure 15-10(b) shows a four-pole configuration obtained by cascading two Sallen-Key (2-pole) low-pass filters. In general, a four-pole filter is preferred because it uses the same number of op-amps to achieve a faster roll-off. FIGURE 15-10: Cascaded low-pass filters. EXAMPLE 15-4: For the four-pole filter in Figure 15-10(b), determine the capacitance values required to produce a critical frequency of 2680 Hz if all the resistors in the RC low-pass circuits are 1.8 k .Also select values for the feedback resistors to get a Butterworth response. Solution Both stages must have the same ?. Assuming equal-value capacitors, ?= 1 (2? ), = 1 (2? ?) = 1 (2?(1.8k )(2680Hz )) = 0.033?F 1 = 1 = 2 = 2 = 0.033 ?F Also we select 2 = 4 = 1.8 k for simplicity. We refer to Table 15-1. For a Butterworth response in the first stage, = 1.848 and 1 2 = 0.152. Therefore, 1 = 0.152 2 = 0.152(1.8k ) = 274 We choose 1= 270 . In the second stage, = 0.765 and 3 4= 1.235.Therefore, 3 = 1.235 4 = 1.235(1.8k ) = 2.22 k We choose 3= 2.2 k . 8
15.4 Active High-Pass Filters In high-pass filters, the roles of the capacitor and resistor are reversed in the RC circuits. ASingle-Pole High-Pass Filters have a 20 dB/decade roll-off as shown in Figure 15-11. FIGURE 15-11: Single-pole active high-pass filter and response curve. The Sallen-Key High-Pass Filter: is shown in Figure 15-12, has two poles (second order) and has a 40 dB/decade roll-off. FIGURE 15-12: Basic Sallen-Key high-pass filter. EXAMPLE 15-5: Choose values for the Sallen-Key high-pass filter in Figure 15-12 to implement an equal-value second-order Butterworth response with a critical frequency of approximately 10 kHz. Solution We start by selecting a value for and ( 1or 2can also be the same value as and for simplicity). = = = 2= 3.3 k (an arbitrary selection) Next, we calculate the capacitance value from ?= 1 (2? ). = = = 1 (2? ?) = 1 (2?(3.3k )(10kHz)) = 0.0048 ?F For a Butterworth response, the damping factor must be 1.414 and 1 2= 0.586. 1 = 0.586 2 = 0.586(3.3k ) = 1.93 k If we had chosen 1= 3.3 k , then 2= 1 0.586 = 3.3 k 0.586 = 5.63k Either way, an approximate Butterworth response is realized by choosing the nearest standard values. 9
Cascading High-Pass Filters: Each additionalfilterin a cascaded arrangement adds 20 dB to the roll-off rate. The response of an active high-pass filter is limited by the internal op-amp roll-off. Figure15-13 shows a six-polehigh-pass filterconsistingof three Sallen-Key two-polestages. With this configuration optimized for a Butterworth response, a roll-off of 120 dB/decade is achieved. FIGURE 15-13: Sixth- order high-pass filter. 15.5Active Band-Pass Filters Band-pass filters pass a specified band of frequencies. Aband-pass responsecan be thoughtof as the overlapping ofa low-frequencyresponse curve and a high-frequency response curve. CascadedLow-PassandHigh-PassFilters:Aband-passfiltercan be achievedbycascading a low-pass and a high-pass filter, as shown in Figure 15-14. FIGURE 15-14: Band-pass filter formed by cascading a two-pole high-pass and a two-pole low-pass filter (it does not matter in which order the filters are cascaded). 10
Multiple-Feedback Band-Pass Filter: The multiple-feedback band-pass filter uses two feedback paths to achieve its response characteristic shown in Figure 15-15. values of less than 10 are typical in this type of filter. FIGURE 15-15: Multiple-feedback band-pass filter. An expression for the center frequency is 0 = 1 (2? ( 1 3) 2 1 2) Making 1 = 2 = yields ? = ( ( ? )) ( + ) ( ) Avaluefor thecapacitorsis chosen and then the threeresistor valuesare calculated to achieve thedesired values for 0, , and 0.As we know, the can be determined fromthe relation = 0 . The resistor values can be found using the following formulas: 1 = (2? 0 0) 2 = ? 0 3 = [2? 0 (2 2 0)] The gain expression, = ( ) Inorderforthedenominatoroftheequation 3 = [2? 0 (2 2 0)]tobepositive, 0 < 2 2, which imposes a limitation on the gain. Equation 15 8 Equation 15 9 EXAMPLE 15-6: Determine the center frequency, maximum gain, and bandwidth for the filter in Figure 15-16. FIGURE 15-16 Solution 0 = (1 (2? )) ( 1 + 3) ( 1 2 3) 1 68 k + 2.7 k 0 =2?(0.01 ?F) 68 k )(180 k )(2.7 k ) ( 0 = 736 Hz 0 = 2 (2 1) = 180 k (2(68 k )) = 1.32 = ? 0 2 = ?(736 Hz)(0.01 ?F)(180 k ) = 4.16 = 0 = 736Hz 4.16 = 177 Hz State-Variable Filter: The state-variable or universal active band-pass filter uses a summing amplifier and two integrators as shown in Figure 15-17. The is set by the feedback resistors 5 and 6 according to the following equation: 1 5 = 3 6 ( + 1) 11
FIGURE 15-17: State-variable filter. EXAMPLE 15-7: Determine the center frequency, , and for the passband of the state- variable filter in Figure 15-18. FIGURE 15-18 Solution For each integrator, ?= 1 (2? 4 1) = 1 (2? 7 2) 1 ?=2?(1.0k )(0.022?F)= 7.23 kHz The center frequency is approximately equal to the critical frequencies of the integrators. 0 = ?= 7.23kHz 1 1 3 3 = 0 = 7.23 kHz 33.7 = 215 Hz The Biquad Filter: The biquad filter consists of an integrator followed by an inverting amplifier and a second integrator as shown in Figure 15-19. (( 5 6)+ 1) = ((100k 1.0 k ) + 1) = 33.7 = FIGURE 15-19: A biquad filter. 12
15.6Active Band-Stop Filters Band-stop filters reject a specified band of frequencies and pass all others. The response is opposite to that of a band-pass filter. Band-stop filters are sometimes referred to as notch filters. Multiple-Feedback Band-Stop Filter: Figure 15-20 shows a multiple-feedback band-stop filter, Multiple-feedback and state-variable are common types of band-stop filters, as shown in Figures 15-20 and 15-21, respectively. FIGURE 15-20: Multiple-feedback band-stop filter. FIGURE 15-21: State-variable band-stop filter. EXAMPLE 15-8: Verify that the band-stop filter in Figure 15-22 has a center frequency of 60 Hz, and optimize the filter for a of 10. FIGURE 15-22 Solution 0 equals the ?of the integrator stages. (In practice, component values are critical). 0 = ?= 1 (2? 4 1) = 1 (2? 7 2) = 1 (2?(12k )(0.22 ?F)) = 60 Hz We can obtain a = 10 by choosing 6 and then calculating 5. = 1 3(( 5 6)+ 1), 5 = (3 1) 6 We choose 6 = 3.3 k . Then 5 = [3(10) 1]3.3k = 95.7k We use the nearest standard value of 100 k . 13


. Figure 15-10(b) shows a")