UCA Financial Performance Overview

•
Select slides, Board PRESENTATION
June 19, 2018

Thank
You
Key financial data of UCA reveals growth in written premium and net profits, while technical income dropped. The company's strong equity base and strategic options for cash allocation are highlighted. Operating highlights showcase transformational developments in 2017, including new headquarters and brand enhancements. The chairman's letter emphasizes underwriting excellence and cautious growth strategies amidst economic challenges.

Uploaded on Feb 20, 2025 | 0 Views
Download Presentation

Please find below an Image/Link to download the presentation.
The content on the website is provided AS IS for your information and personal use only. It may not be sold, licensed, or shared on other websites without obtaining consent from the author.If you encounter any issues during the download, it is possible that the publisher has removed the file from their server.
You are allowed to download the files provided on this website for personal or commercial use, subject to the condition that they are used lawfully. All files are the property of their respective owners.
The content on the website is provided AS IS for your information and personal use only. It may not be sold, licensed, or shared on other websites without obtaining consent from the author.
E N D
Presentation Transcript
Select slides, Board PRESENTATION June 19, 2018
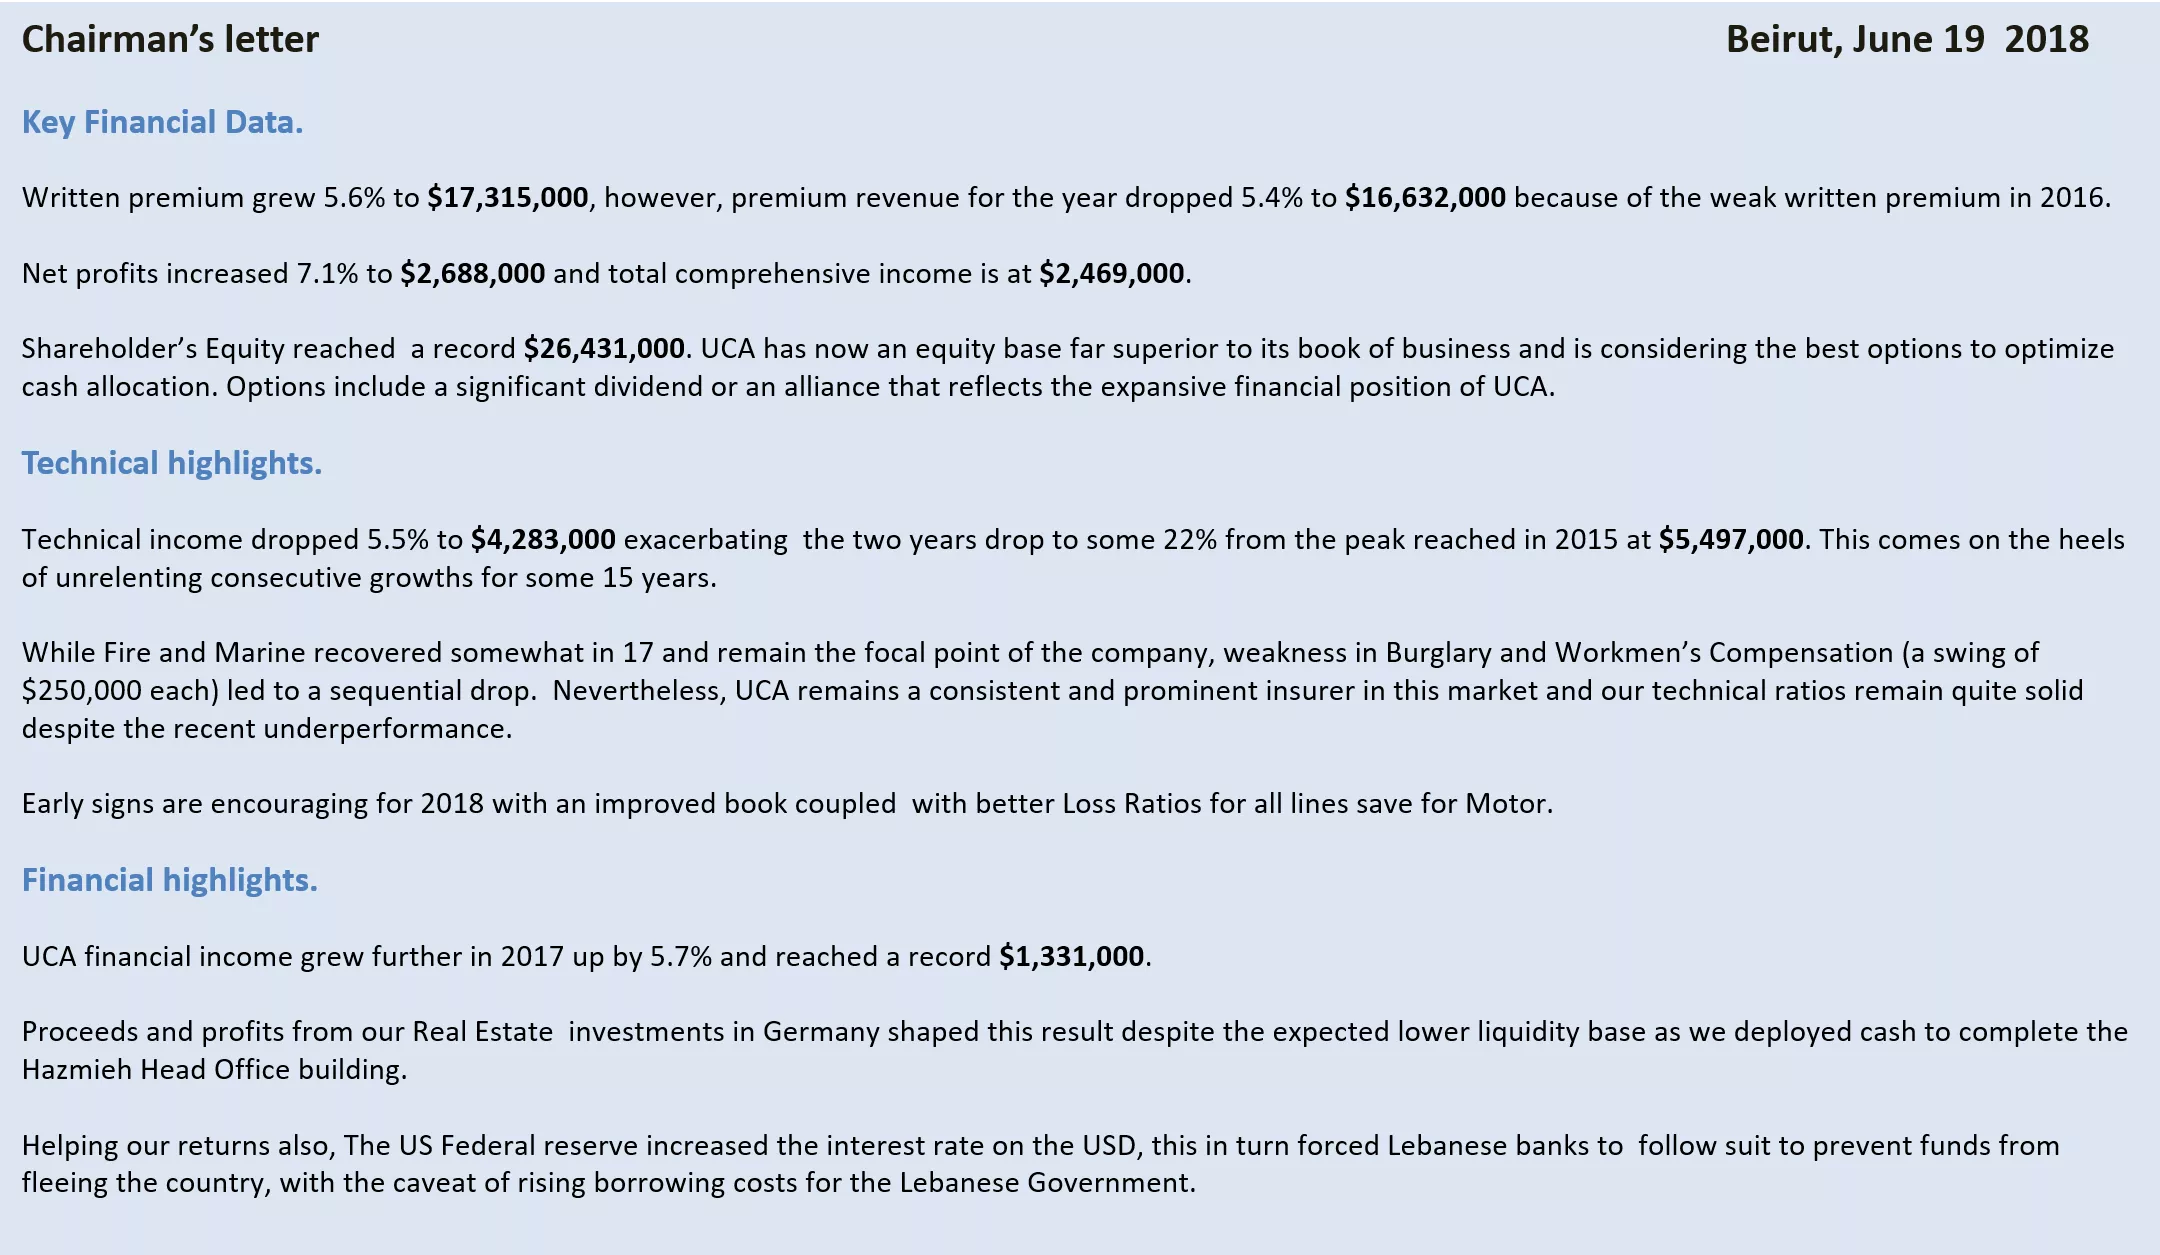
Chairmans letter Beirut, June 19 2018 Key Financial Data. Written premium grew 5.6% to $17,315,000, however, premium revenue for the year dropped 5.4% to $16,632,000 because of the weak written premium in 2016. Net profits increased 7.1% to $2,688,000 and total comprehensive income is at $2,469,000. Shareholder s Equity reached a record $26,431,000. UCA has now an equity base far superior to its book of business and is considering the best options to optimize cash allocation. Options include a significant dividend or an alliance that reflects the expansive financial position of UCA. Technical highlights. Technical income dropped 5.5% to $4,283,000 exacerbating the two years drop to some 22% from the peak reached in 2015 at $5,497,000. This comes on the heels of unrelenting consecutive growths for some 15 years. While Fire and Marine recovered somewhat in 17 and remain the focal point of the company, weakness in Burglary and Workmen s Compensation (a swing of $250,000 each) led to a sequential drop. Nevertheless, UCA remains a consistent and prominent insurer in this market and our technical ratios remain quite solid despite the recent underperformance. Early signs are encouraging for 2018 with an improved book coupled with better Loss Ratios for all lines save for Motor. Financial highlights. UCA financial income grew further in 2017 up by 5.7% and reached a record $1,331,000. Proceeds and profits from our Real Estate investments in Germany shaped this result despite the expected lower liquidity base as we deployed cash to complete the HazmiehHead Office building. Helping our returns also, The US Federal reserve increased the interest rate on the USD, this in turn forced Lebanese banks to follow suit to prevent funds from fleeing the country, with the caveat of rising borrowing costs for the Lebanese Government.
Operating highlights. 2017 was a transformational year for UCA. We completed the construction and decoration of our new UCA building in Jisr-El-Basha, and we used this opportunity to hire BBDO to review the branding and communication message of the company and uplift the logo, furthermore, to launch a LinkedIn and Facebook page. We are now redesigning our internet site to finalize this comprehensive process. We also upgraded our IT servers and networks and our communications system. The move to our new HO was completed seamlessly during February 2018, and we now occupy a green, secure, branded and modern landmark building that offers UCA a home to grow for the next several decades and a visibility it has craved. It also improves substantially the way we interact with our clients and partners, with ample visitor parking spaces, a modern Motor claims center and multiple meeting rooms, in a stylish and convivial working environment. Outlook. The Lebanese economy has stagnated for the past 7 years, with negligible growth and ever increasing stress on the financial system due to the rising national debt to GDP ratio. This, within a backdrop of wars and tensions in our immediate geopolitical territory. I am aware and alert to the challenges and realize the need for revenue growth so that UCA continues to play a preeminent role in the Lebanese insurance sector, especially now, having invested significantly in our new HQ. But I will always favor underwriting excellence and will err on the side of caution when given a choice, I believe this is the cornerstone of our business model and what has and will always define us. Finally, I will continue to rely on our seasoned and competent team, our stable and loyal client base that we serve with passion and the resolute support of our shareholders. Sincerely, Jacques G. Sacy Chairman of the Board & Managing Director
Shareholders Equity /Dividend distributes 30,000 26,438 Shareholder Equity End of Year Dividend Distributed during the Year 24,706 25,000 23,171 21,197 19,266 20,000 17,325 15,092 15,000 13,564 11,632 9,764 9,261 10,000 5,000 1,318 995 995 995 750 737 730 663 663 498 498 0 2007 2008 2009 2010 2011 2012 2013 2014 2015 2016 2017
Net Profit 3,500 3,329 2,979 3,000 2,792 2,757 2,688 2,666 2,588 2,510 2,500 2,294 2,000 1,768 1,468 1,500 1,000 500 0 2007 2008 2009 2010 2011 2012 2013 2014 2015 2016 2017
NET PROFIT AS A % OF EQUITY 19.21% 14.05% 13.84% 10.38% 10.88% 2013 2014 2015 2016 2017
Written Premiums (in Thousand $) 20,000 18,654 18,600 17,847 17,832 17,315 17,736 18,000 16,403 16,000 14,572 14,523 14,000 11,374 12,000 10,393 10,000 8,000 6,000 4,000 2,000 0 2007 2008 2009 2010 2011 2012 2013 2014 2015 2016 2017
Written premium by line of business 2017 Life 7% Others 10% Fire 34% Marine 9% Medical 10% Motor 30%
Premium Revenue (in Thousand $) 20,000 18,526 18,303 17,971 17,943 17,585 18,000 16,632 15,368 16,000 13,674 14,000 11,568 12,000 10,542 10,269 10,000 8,000 6,000 4,000 2,000 0 2007 2008 2009 2010 2011 2012 2013 2014 2015 2016 2017
Shareholders Equity as a % of Written Premiums 50.62% 52.69% 29.83% 13.63% 8.63% 2007 2008 2009 2010 2011 2012 2013 2014 2015 2016 2017 -6.05% -6.60% -6.85% -15.37% -18.58% -20.18%
Cash & Investments (in Thousand USD) 24,416 24,255 23,829 23,737 21,722 20,048 19,808 18,628 16,352 15,319 13,672 2007 2008 2009 2010 2011 2012 2013 2014 2015 2016 2017
Cash & Investments as a % of Shareholders Equity 114.43% 112.75% 102.84% 98.83% 89.78% 2013 2014 2015 2016 2017
Fire & Marine Tech. Profits vs Remaining Classes (in Thousand $) 3,500 3,141 3,123 3,001 3,000 2,873 2,799 2,734 2,686 2,500 2,364 2,3562,296 2,110 2,092 2,001 2,003 1,884 2,000 1,863 Fire+Marine 1,597 Remaining 1,400 1,500 1,289 1,000 758 500 0 2008 2009 2010 2011 2012 2013 2014 2015 2016 2017
Financial Income = Dividends + Interest + F. markets 1,400 1,331 1,259 1,200 1,000 1,025 1,017 994 994 800 836 600 400 200 120 153 339 14 16 181 87 0 2011 2012 2013 2014 2015 2016 2017 UIC+Arab Re
Income in Thousand USD 6,800 5,803 7,272 6,496 7,200 6,250 6,101 6,444 100% 150.2 200.3 200.3 588.9 617.10 791.11 992.15 936.16 1400.19 1300.21 1400.21 1017.16 1067.15 80% 1259.21 1331.37 60% 5005.86 40% 5600.78 4800.77 5200.76 4890.75 5414.74 4225.69 4120.64 20% 0% -138.2 Audited 31.12.2013 Audited 31.12.2014 Audited 31.12.2015 Audited 31.12.2016 Audited 31.12.2017 2018 E 2019 E 2020 E -20% Total Technical Income Total Financial Income Total Other Income Total Net Income
Expenses in Thousand USD 2,892 3,989 3,334 3,750 4,120 2,872 3,489 4,350 100% 223.7 275.1 382.11 450.12 393.14 600.14 600.15 90% 1110.28 501.15 414.12 439.15 500.13 80% 550.13 520.13 442.15 70% 447.11 60% 50% 40% 2610.78 2692.77 2158.75 2800.75 3200.74 3000.73 2057.71 2432.61 30% 20% 10% 0% Audited 31.12.2013 Audited 31.12.2014 Audited 31.12.2015 Audited 31.12.2016 Unaudited 31.12.2017 2018 E 2019 E 2020 E Wages & Salaries Total General Expenses Total Other Expenses Total Total Expenses
Net Profit (Projected) 3,500 3,329 2,979 3,000 2,792 2,757 2,688 2,666 2,588 2,512 2,510 2,500 2,380 2,294 2,220 2,000 1,768 1,468 1,500 1,332 972 1,000 625 525 500 0 2003 2004 2005 2006 2007 2008 2009 2010 2011 2012 2013 2014 2015 2016 2017 2018E 2019E 2020E


")

")

")


")