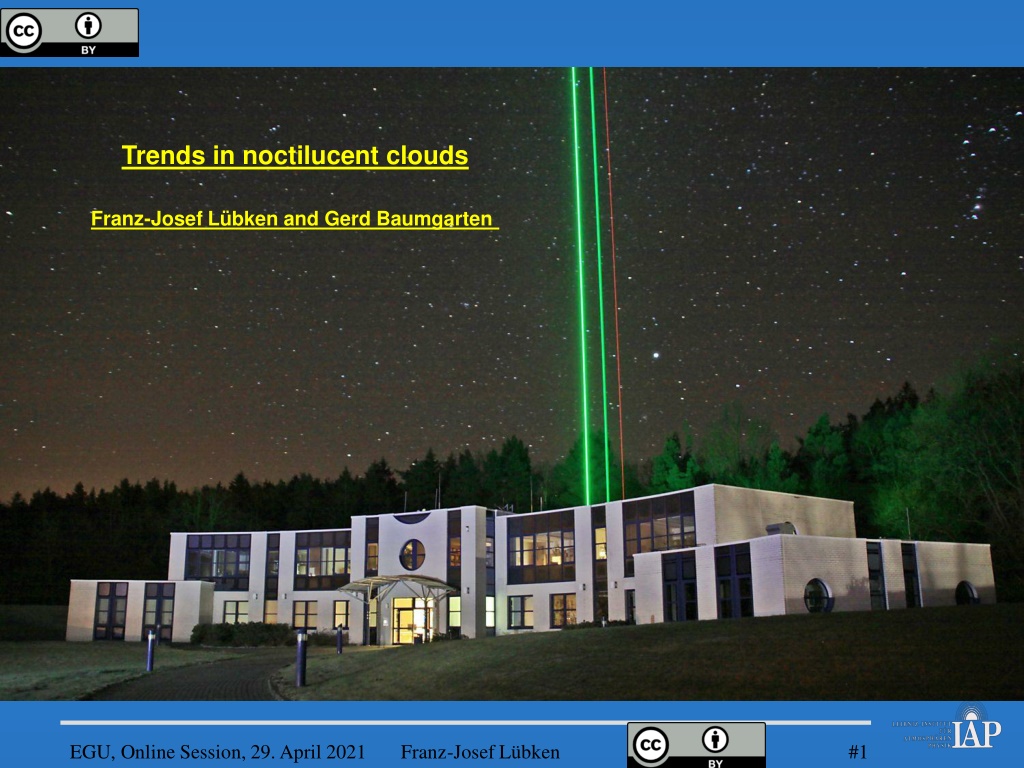
Trends in noctilucent clouds
In this study, Franz-Josef Lübken and Gerd Baumgarten explore trends in noctilucent clouds. The research covers topics such as LIMA/MIMAS model snapshots, temperature variations close to NLCs, brightness observations, NLC occurrence rates, and comparisons with visual observations. The data presented sheds light on the behavior and characteristics of these mysterious clouds.
Download Presentation

Please find below an Image/Link to download the presentation.
The content on the website is provided AS IS for your information and personal use only. It may not be sold, licensed, or shared on other websites without obtaining consent from the author.If you encounter any issues during the download, it is possible that the publisher has removed the file from their server.
You are allowed to download the files provided on this website for personal or commercial use, subject to the condition that they are used lawfully. All files are the property of their respective owners.
The content on the website is provided AS IS for your information and personal use only. It may not be sold, licensed, or shared on other websites without obtaining consent from the author.
E N D
Presentation Transcript
Trends in noctilucent clouds Franz-Josef L bken and Gerd Baumgarten EGU, Online Session, 29. April 2021 Franz-Josef L bken #1
LIMA/MIMAS model: Snapshot of ice cloud at one location max L bken et al., Geophys. Res. Lett., 2018 EGU, Online Session, 29. April 2021 Franz-Josef L bken
temperature close to NLC: @p and @z at fixed height 83 km at fixed pressure (close to NLC) 1880 2000 1940 L bken et al., Geophys. Res. Lett., 2018 EGU, Online Session, 29. April 2021 Franz-Josef L bken #3
1871-2008 3 runs: L bken et al., Geophys. Res. Lett., 2018 Hefei, Trend Workshop, 14-18 May 2018 Franz-Josef L bken #4
brightness of NLC (beta-max) ! L bken et al., Geophys. Res. Lett., 2018 EGU, Online Session, 29. April 2021 Franz-Josef L bken #5
brightness of NLC (beta-max) LIMA: appr. 2% per decade ! L bken et al., Geophys. Res. Lett., 2018 EGU, Online Session, 29. April 2021 Franz-Josef L bken #6
NLC observed from the ground (Pertsev et al., EPS, 2014) with weather corrections LIMA: appr. 2% per decade => +0.32 marks in 24 years EGU, Online Session, 29. April 2021 Franz-Josef L bken #7
Lidar at IAP in Khlungsborn normal 21. Juni 2019 (Faktor 30) courtesy of IAP EGU, Online Session, 29. April 2021 Franz-Josef L bken #8
occurrence rate of NLC Consistent with PMSE occurence 78 N 69 N 58 N bmax>0. L bken et al., J. Atmos. Solar-Terr. Phys., 2021 EGU, Online Session, 29. April 2021 Franz-Josef L bken #9
Comparing with visual observations Observations from Kirkwood et al., AG, 2008 L bken et al., J. Atmos. Solar-Terr. Phys., 2021 EGU, Online Session, 29. April 2021 Franz-Josef L bken #10
The altitude of NLC @ 69N Model (LIMA/MIMAS) L bken et al., J. Atmos. Solar-Terr. Phys., 2021 EGU, Online Session, 29. April 2021 Franz-Josef L bken #11
NLC altitude decreases due to CO2 increase L bken et al., J. Atmos. Solar-Terr. Phys., 2021 EGU, Online Session, 29. April 2021 Franz-Josef L bken #12
Brightness of cloud is a good measure of the total amount of ice water in a column r=0.988 69 N true at all latitudes but with different slopes L bken et al., J. Atmos. Solar-Terr. Phys., 2021 EGU, Online Session, 29. April 2021 Franz-Josef L bken #13
Conclusions It must be cold enough to allow ice particles to grow (<150K). Further cooling changes altitude of NLC (shrinking), but has little impact on brightness etc. Increase of H2O increases total ice mass and brightness Increase of H2O enhances chance to see a NLC Conclusion: NLC are indicator of climate change more precisely: increase of CH4 >>> H2O NLC were presumably present before 1880s, but very seldom LIMA/MIMAS results agree nicely with observations EGU, Online Session, 29. April 2021 Franz-Josef L bken #14
recent publications: EGU, Online Session, 29. April 2021 Franz-Josef L bken #15
