Trends in College Mental Health Indicators: 2009-2018 Surveys
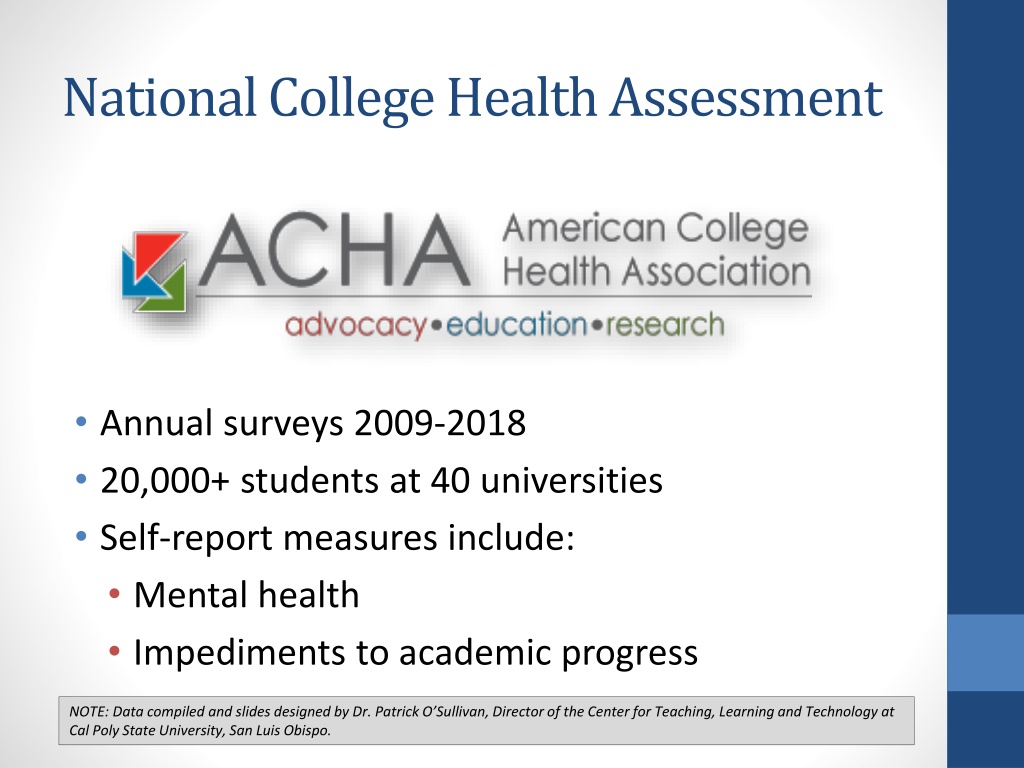


National College Health Assessment
•
Annual surveys 2009-2018
•
20,000+ students at 40 universities
•
Self-report measures include:
•
Mental health
•
Impediments to academic progress


NOTE: Data compiled and slides designed by Dr. Patrick O’Sullivan, Director of the Center for Teaching, Learning and Technology at
Cal Poly State University, San Luis Obispo.

Source: American College Health Association | National College Health Assessment | Spring 2009-14

32%
Source: American College Health Association | National College Health Assessment | Spring 2009-14
32%
Source: American College Health Association | National College Health Assessment | Spring 2009-14
32%
Source: American College Health
Association | National College
Health Assessment | Spring 2014
Source: American College Health
Association | National College
Health Assessment | Spring 2014
Source: American College Health
Association | National College
Health Assessment | Spring 2014
Source: American College Health Association | National College Health Assessment | Spring 2009-14
32%
Source: American College Health Association | National College Health Assessment | Spring 2014
Source of data about college students that can provide us with insights that allow us to see beyond stereotypes and set aside assumptions we may hold about Cal Poly students
- Lots of data such as
- Nutrition and exercise
- Disease
- Drug and tobacco use
- Sexual behavior
- Abusive relationships and safety
I focused on these two sections as most relevant to our work as educators:
- Mental health indicators
- Impediments to academic progress
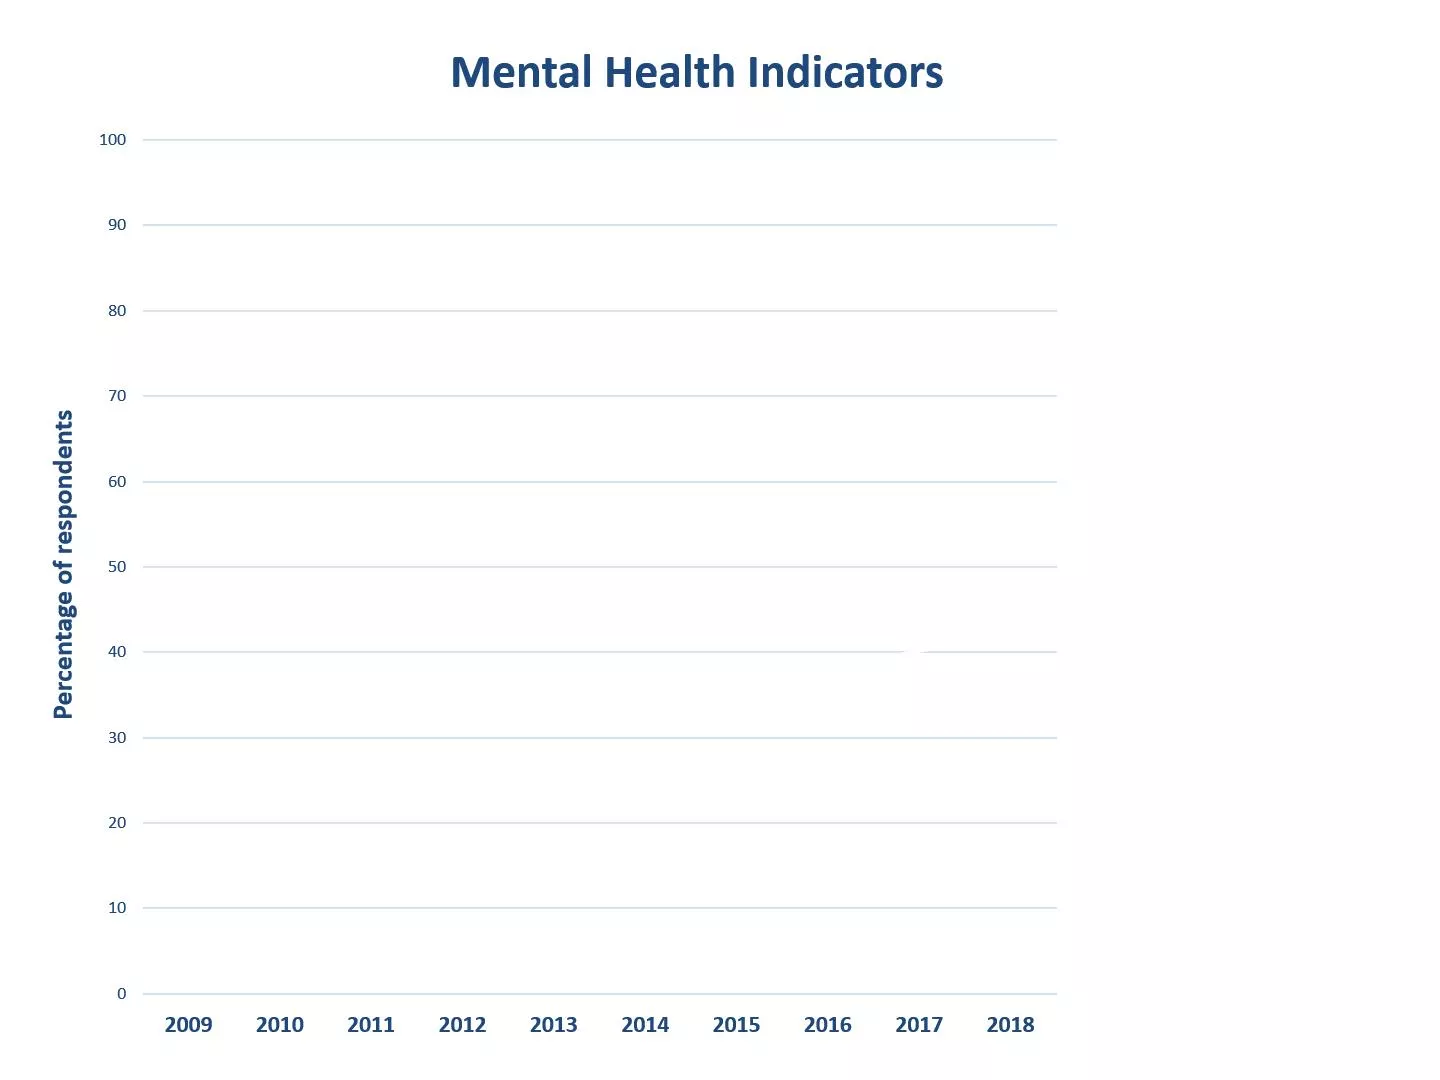
Annual surveys from 2009 to 2018, involving over 20,000 students at 40 universities, assessed mental health issues impacting academic progress. Self-reported data by the American College Health Association highlights trends in depression, anger, anxiety, loneliness, and exhaustion among students over the years.

Download Presentation

Please find below an Image/Link to download the presentation.
The content on the website is provided AS IS for your information and personal use only. It may not be sold, licensed, or shared on other websites without obtaining consent from the author. Download presentation by click this link. If you encounter any issues during the download, it is possible that the publisher has removed the file from their server.
E N D
Presentation Transcript
National College Health Assessment Annual surveys 2009-2018 20,000+ students at 40 universities Self-report measures include: Mental health Impediments to academic progress NOTE: Data compiled and slides designed by Dr. Patrick O Sullivan, Director of the Center for Teaching, Learning and Technology at Cal Poly State University, San Luis Obispo.
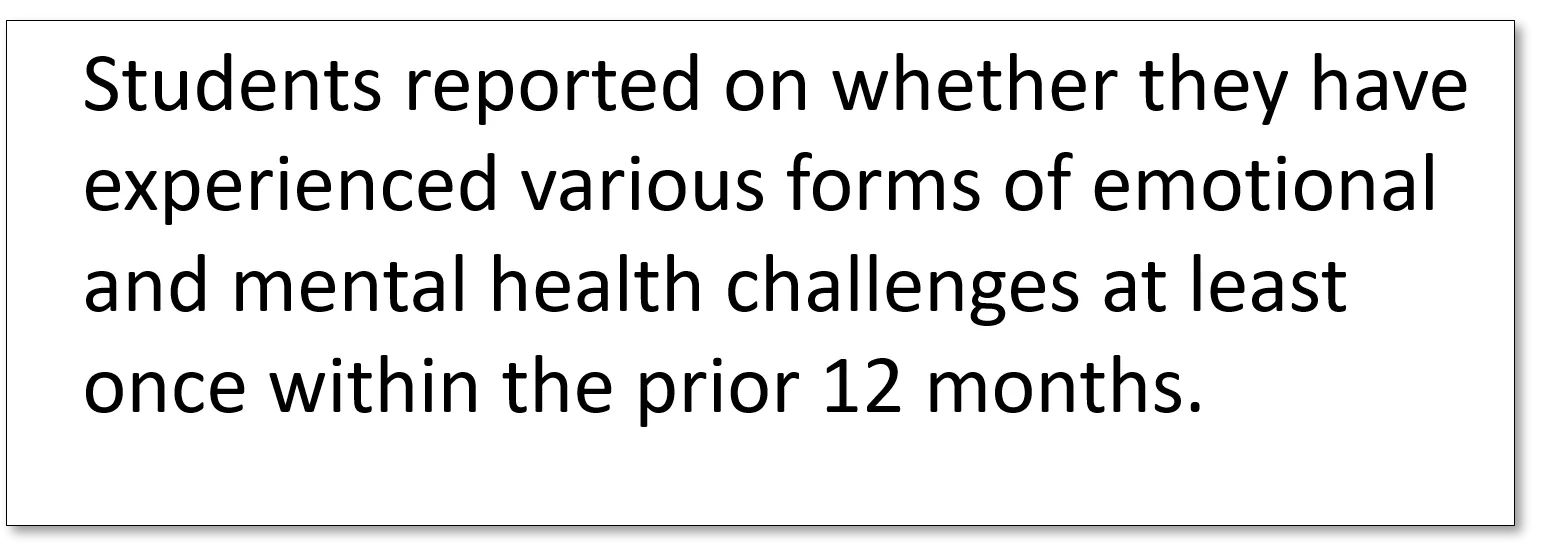
Mental Health Indicators Source: American College Health Association | National College Health Assessment | Spring 2009-14 100 90 32% 80 Students reported on whether they have experienced various forms of emotional and mental health challenges at least once within the prior 12 months. 70 Percentage of respondents 60 50 40 30 20 10 0 2009 2010 2011 2012 2013 2014 2015 2016 2017 2018
Mental Health Indicators Source: American College Health Association | National College Health Assessment | Spring 2009-14 100 90 32% 80 70 depressed Percentage of respondents overwhelming anger 60 hopeless overwhelming anxiety 50 lonely very sad 40 exhausted overwhelmed 30 20 10 0 2009 2010 2011 2012 2013 2014 2015 2016 2017 2018
Mental Health Indicators Source: American College Health Association | National College Health Assessment | Spring 2009-14 100 90 32% 80 70 depressed Percentage of respondents overwhelming anger 60 hopeless overwhelming anxiety 50 lonely very sad 40 exhausted overwhelmed 30 20 10 0 2009 2010 2011 2012 2013 2014 2015 2016 2017 2018
Mental Health Indicators | Spring 2018 National Data 100 90 87.1 82 80 70 64.7 59.5 58.6 60 Association | National College Source: American College Health Health Assessment | Spring 2014 49.6 50 40.3 36 40 30 20 10 0 Depressed Can't Function Overwhelming Anger Hopeless Overwhelming Anxiety Lonely Very Sad Exhausted Overwhelmed
Mental Health Indicators | Spring 2018 National Data: Males vs. Females 100 96.2 90 92 Males Females 80 77.7 73.1 70 69.3 64.4 63 60 Association | National College Source: American College Health Health Assessment | Spring 2014 54 53 50 51.3 45.6 40 42.3 41.2 38.3 35.2 30 29.8 20 10 0 Depressed Can't Function Overwhelming Anger Hopeless Overwhelming Anxiety Lonely Very Sad Exhausted Overwhelmed
Mental Health Indicators | Spring 2018 National Data 100 90 87.1 80 82 70 64.7 60 58.6 59.5 Association | National College Source: American College Health Health Assessment | Spring 2014 50 49.6 40 40.3 36 30 20 10 0 Depressed Can't Function Overwhelming Anger Hopeless Overwhelming Anxiety Lonely Very Sad Exhausted Overwhelmed
Mental Health Indicators | Spring 2018 National vs. Cal Poly 100 90.7 89.4 90 87.1 80 82 73.6 70.2 70 63.9 64.7 60 55.8 59.5 58.6 50 49.6 40 40.3 36 30 20 10 0 0 0 Depressed Can't Function Overwhelming Anger Hopeless Overwhelming Anxiety Lonely Very Sad Exhausted Overwhelmed Total CP2018
Factors Affecting Academic Performance (experienced in past 12 months) Mental Health Indicators | Self Harm National Sample | Spring 2018 Source: American College Health Association | National College Health Assessment | Spring 2009-14 100 20 90 32% 18 80 16 14 70 Percentage of respondents depressed Percentage of Respondents overwhelming anger seriously considered suicide 12 60 hopeless injured self 10 overwhelming anxiety 50 lonely 8 attempted suicide very sad 40 exhausted 6 30 overwhelmed 4 20 2 10 0 2009 2010 2011 2012 2013 2014 2015 2016 2017 2018 0 2009 2010 2011 2012 2013 2014 2015 2016 2017 2018
Factors Affecting Undergraduates' Academic Performance, 2009-2018 Source: American College Health Association | National College Health Assessment | Spring 2014 40 Within the last 12 months, students reported the following factors affecting their individual academic performance, defined as: Receiving a lower grade on exam or important project; Receiving a lower grade in the course; Receiving an incomplete or dropping the course 35 30 Percentage of Respondents 25 Stress Anxiety Sleep difficulties 20 Cold/flu Work 15 Depression 10 5 0 2009 2010 2011 2012 2013 2014 2015 2016 2017 2018
Factors Affecting Undergraduates' Academic Performance, 2009-2018 45 40 35 30 Percentage of Respondents Stress 25 Anxiety Sleep difficulties Cold/flu 20 Work Depression 15 10 5 0 2009 2010 2011 2012 2013 2014 2015 2016 2017 2018
Factors Affecting Undergraduates' Academic Performance, 2009-2018 45 40 35 30 Percentage of Respondents Stress 25 Anxiety Sleep difficulties Cold/flu 20 Work Depression 15 10 5 0 2009 2010 2011 2012 2013 2014 2015 2016 2017 2018
Factors Affecting Undergraduate Academic Performance National vs. Cal Poly 2018 45 40 2018 34.1 35 30 27.4 25 22.1 20 18.2 14.4 15 13 10.9 9.1 10 5 0 Online activities Work Cold/flu Depression Sleep difficulties Anxiety Stress Extracurricular
Factors Affecting Undergraduate Academic Performance National vs. Cal Poly 2018 45 43.4 40 2018 CP2018 34.1 35 32.8 30 27.4 26.4 25.5 25 22.1 20.5 20 18.2 16.5 14.8 14.4 15 13 12.2 10.9 9.1 10 5 0 Online activities Work Cold/flu Depression Sleep difficulties Anxiety Stress Extracurricular