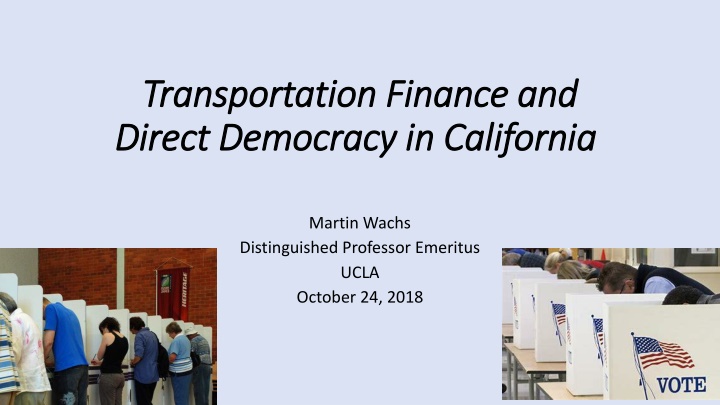
Transportation Finance and Direct Democracy in California
Proposition 6 on November 6th has garnered attention, but voters in multiple states will decide on over 250 transportation ballot measures totaling over $55 billion. California, with a longer history and greater funding needs, has been at the forefront of transportation investments, including the use of Local Option Sales Taxes (LOSTs). The trend indicates a shift towards local responsibility for transportation funding. Various states will also vote on transportation-related measures, highlighting the significance of these decisions in shaping transportation infrastructure across the country.
Download Presentation

Please find below an Image/Link to download the presentation.
The content on the website is provided AS IS for your information and personal use only. It may not be sold, licensed, or shared on other websites without obtaining consent from the author.If you encounter any issues during the download, it is possible that the publisher has removed the file from their server.
You are allowed to download the files provided on this website for personal or commercial use, subject to the condition that they are used lawfully. All files are the property of their respective owners.
The content on the website is provided AS IS for your information and personal use only. It may not be sold, licensed, or shared on other websites without obtaining consent from the author.
E N D
Presentation Transcript
Transportation Finance and Transportation Finance and Direct Democracy in California Direct Democracy in California Martin Wachs Distinguished Professor Emeritus UCLA October 24, 2018
November November 6th 6th Proposition 6 has our attention but Voters across the country will decide whether they want their city, county, or state to invest more (or less)in transportation. Voters in 25 states will decide on over 250 transportation ballot measures on Nov 6th. Totaling over $55 billion in potential investment. 196 measures have already appeared before voters earlier this year.
Voting for transportation dollars is a big deal & Voting for transportation dollars is a big deal & we need to understand it . we need to understand it . Look at the history of voting for transportation investments Consider California specifically More measures than any other state Longer history than any other state More money needed and raised than any other state Take a deep dive into Local Option Sales Taxes (LOSTs) - A California Invention Santa Clara County is central to this history The first LOST in 1976; The Guardino decision and two recent measures NOT predict, analyze or take a position on Proposition 6
Wide variety of transportation ballot measures Wide variety of transportation ballot measures across the county across the county general revenue & user fees general revenue & user fees Property tax increases Real estate transaction taxes Vehicle license fees Fuel tax increases Many statewide measures but steady pattern of devolution from federal to state to local responsibility for transportation funding In California of total $35 billion per year (Before SB1): $16 billion from local governments $12 billion from state $7 billion from federal sources.
Some measures in other states on Nov. 6th Some measures in other states on Nov. 6th Connecticut: Voters will decide on a constitutional amendment to put the state s Special Transportation Fund into a trust fund. Colorado: Voters will consider two competing transportation measures: one that raises new revenue for all transportation modes, and one that funds road improvements using existing revenue. Missouri: Voters will vote on Proposition D, which would raise the gasoline tax to fund transportation improvements. Hillsborough County (Tampa), Florida: Voters will decide whether to raise the sales tax to fund transportation improvements.
Direct Democracy in California has a long history for Direct Democracy in California has a long history for transportation projects transportation projects e.g. LA County e.g. LA County
Between 1930 and 1970 there were few Between 1930 and 1970 there were few transportation ballot measures transportation ballot measures States adopted gasoline and diesel fuel taxes between 1918 and 1940 Federal gasoline tax Federal highway trust fund adopted in 1956 Hypothecation or earmarking through trust funds Car ownership and miles of driving grew steadily and revenue grew in parallel with expenditures
Declining Federal funding led to recent Declining Federal funding led to recent increase in propositions & initiatives increase in propositions & initiatives Congress increased Federal gas tax 8 times between 1956 & 1993 every 4 to 5 years No Federal fuel tax Increase since 1993 $0.184/gal Federal gas tax was 17% of price at the pump in 1993; in 2017 it was 8% Purchasing power of gas tax fed and state - declined by 35% between 2003 and SB1 Inflation & increases in MPG slowed revenue in relation to driving
Vehicle fuel efficiency gains reduce revenue Vehicle fuel efficiency gains reduce revenue
VMT growth will outpace fuel consumption increase for decades Index (1980 = 100%) 2 . 300 VMT (FHWA) 1 .5 250 VMT (EIA) 1 .0 200 0 .5 150 Fuel consumption 0 .0 100 -0 .5 50 1980 1990 2000 2010 2020 2030
Many statewide transportation revenue Many statewide transportation revenue measures in recent years measures in recent years A small sampling: Transportation Development Act(TDA) in 1971 Very complex & important, created the transit account Proposition 1A - $9.95 Billion in High Speed Rail Bonds in 2009 added many restrictions on High Speed Rail Program Proposition 91 in 2009 tried to create a locked box for all transportation revenue and was defeated Proposition 69 in June of this year tried again and was approved. Do voters understand the issues they are voting on? Do they understand the complexity of the measures given the simple campaign slogans? Do they change their minds after voting?
CA invented the Local Option Sales Tax (LOST) CA invented the Local Option Sales Tax (LOST) Proposition 13 created the context - property tax revenue less available Voter approved sales taxes Expenditure plans enumerated in measures Most have fixed sunset dates and need to be reauthorized Many have accountability provisions & limits on amendments
California LOSTS over time California LOSTS over time 14 Simplemajority required to pass Supermajority required to pass No measures in 2017; three county measures on November 2018 ballot 12 6 5 Number of Measures per Year 10 8 7 6 5 4 8 8 2 5 1 1 2 4 3 3 2 2 2 2 2 2 1 1 1 1 1 1 0 1976 1980 1986 1987 1988 1989 1990 1996 1998 2000 2002 2003 2004 2006 2008 2012 2014 2016 Failed Passed
Research on LOSTs at UCLA Research on LOSTs at UCLA Collected the text of 53 county measures (rural, earliest, failed measures not found) Collected pro and con campaign material and media coverage Voting records by precinct correlated with census data Interviews with 50+ election officials, measure proponents and opponents
Measure Support Over Time Measure Support Over Time Since the 1995 Guardino Decision: 8 of 50 measures (16%) failed to garner a simple majority 15 of the 50 (30%) received a majority of votes in favor, but not a supermajority 27 of the 50 (54%) received supermajority support and were enacted
Terms of the Taxes in LOSTs Terms of the Taxes in LOSTs 30 93% of California LOSTs have specified lives; only five were permanent, and four of these passed: Los Angeles, Proposition A, 1980 Los Angeles, Proposition C, 1990 Los Angeles, Measure M, 2016 (also made earlier measure permanent) Santa Clara, Measure A1, 1976 (failed) 28 25 25 20 Number of Measures 15 10 7 6 4 5 3 0 8-15 16-19 20 21-25 30 40 Number of Years
LOST tax burden as % of household income LOST tax burden as % of household income LOSTs are regressive but so are fuel taxes. LOSTs may be doubly regressive. Despite this, the are popular because they are borne in many small transactions rather than fewer larger ones
LOSTs have created a new transportation LOSTs have created a new transportation politics politics LOSTs do not pass just because they are inherently popular An industry of campaign consultants and public officials have learned by trial and error how to get votes and measures are shaped according to a complex set of principles based on precedent. Does what is done to achieve a supermajority of votes match what would be the best transportation plan for a county if voting was not required? The question is in a sense academic because the revenue is needed and elections are held; and, of course we differ from one another in our beliefs as to how much should be spent on what but it is not an unimportant question either voting is not benefit cost analysis.
Example of the new politics of transportation Example of the new politics of transportation In three counties (Riverside, Orange, San Diego) early measures were vehemently opposed by environmental groups (e.g. Sierra Club, NRDC) - roads destroy the environment! In later measures those counties committed to spending money on acquiring land to mitigate transportation impacts on the environment advance mitigation - under the Endangered Species Act. Environmental groups encouraged their members to vote FOR those measures and they were approved. Transportation advocates did not want to spend transportation money to protect the kangaroo rat but wanted the measures to pass
If you try and dont succeed..try & try again If you try and don t succeed ..try & try again Sonoma County % LOSTs Sonoma County % LOSTs 1990 Transit & Road Improvements Failed 46.0% 1998 Highway, Road, Transit, Bike & Failed 47.6% Pedestrian Projects 2000 Highway Improvements Failed 58.5% 2000 Rail/Bus Road Maintenance, Failed 60.3% Pedestrian & Bicycle Projects 2004 Highway, Road, Transit, Bike, Passed 67.2% Pedestrian Projects
Designing LOSTs to win Designing LOSTs to win Spread the money geographically, especially to highly populated areas Spread the money across modal interests .highways, rail, bikes, pedestrians, ferries. Spread the money over time but make sure each constituency gets some early benefits. Balance among capital projects and operating projects. Promise relief on many fronts for many interests. But, all politics are local and there are a few exceptions reflecting that .e.g. fund only one program or project or mode, particularly where there is an earlier measure in place
LOSTS fund many programs to attract many LOSTS fund many programs to attract many constituencies constituencies Share of all LOST money by mode Comments Urban counties allocate a larger share of funds raised by LOSTs to transit than transit s share of trips in those counties Rural counties spend mostly on local roads For each mode shown counties also differ in terms of capital versus operating expenditures Mode Mean Median Range Highways 27% 26% 0-66% Public Transit 31% 26% 0-100% Local Roads 34% 30% 0-100% Bike/Pedestrian 2.4% 0.7% 0-17% Safe Routes to School 1.8% 0% 0-11% Seniors/Disabled 4.4% 1% 0-100%
Spatial Distribution of Voter Support, Santa Clara Spatial Distribution of Voter Support, Santa Clara County Measure A (2000) & Measure B (2008) County Measure A (2000) & Measure B (2008)
Equity Argument Frequency in LOST Measures Ballot arguments refer to equity rather loosely; Ballot arguments refer to equity rather loosely; far more frequently in opposition far more frequently in opposition Measure M is a SALES TAX INCREASE that will damage our economy, hurting those who can least afford it ...because this is a sales tax, Measure A will hit seniors and working families especially hard Many elderly citizens live in poverty. This tax will hurt seniors; reduces their buying power Number of Measures in which Equity is Debated Type of Equity General Equity 29 Income Equity 14 Geographic Equity 28 Modal Equity 26 Temporal Equity 8
Congestion Relief is always promised and most Congestion Relief is always promised and most popular, hard to measure, rarely delivered popular, hard to measure, rarely delivered Vote YES on Measure M to relieve congestion, improve traffic safety and fix local roads without raising taxes! Vote YES to reduce gridlock and improve police, fire and paramedic response times. Relieve traffic congestion on all Expressways and key highway interchanges
Local return is increasing over time Local return is increasing over time 100% 95% Average Percentage of Measure Revenue Dedicated to Local 90% 80% 70% 60% Return 50% 45% 42% 41% 41% 40% 29% 30% 25% 25% 20% 20% 18% 20% 15% 11% 10% 0% 1980 1986 1988 1989 1990 2000 2002 2004 2006 2008 2012 2014 2016 Year
My big worry My big worry To get a supermajority vote, we promise more than we can deliver. Once the taxes are in place and the projects are under construction, we find we do not have enough money to complete the projects to which we have committed. The more we raise taxes, the more we need to raise taxes. This is a really big problem. Los Angeles has FOUR half cent permanent measures and will raise $240 billion in forty years. It has bonded against future tax revenue and yet is looking for more funding.
Research is Continuing Research is Continuing We do not yet completely understand the complex new politics of LOSTs We are looking in depth into local returns how much used for what and where? We are looking in depth into accountability. Are any counties shifting money away from promised projects? We are analyzing lawsuits brought against counties for violating their LOSTs Research on voter behavior & understanding is still needed.
THANK YOU! ITS TIME FOR YOUR QUESTIONS AND COMMENTS Contact me at: mwachs@ucla.edu
