Trade Dynamics in the Customs Union of Belarus, Kazakhstan, and Russia: A 2010-2011 Analysis
The paper examines trade trends within the Customs Union (CU) of Belarus, Kazakhstan, and Russia in 2010-2011, focusing on trade creation and diversion effects. It analyzes the impact of the CU on member countries like Kazakhstan, emphasizing the potential outcomes of improved trade facilitation. Key factors influencing trade patterns and expectations from the CU are discussed to provide insights into regional trade dynamics.
Download Presentation

Please find below an Image/Link to download the presentation.
The content on the website is provided AS IS for your information and personal use only. It may not be sold, licensed, or shared on other websites without obtaining consent from the author.If you encounter any issues during the download, it is possible that the publisher has removed the file from their server.
You are allowed to download the files provided on this website for personal or commercial use, subject to the condition that they are used lawfully. All files are the property of their respective owners.
The content on the website is provided AS IS for your information and personal use only. It may not be sold, licensed, or shared on other websites without obtaining consent from the author.
E N D
Presentation Transcript
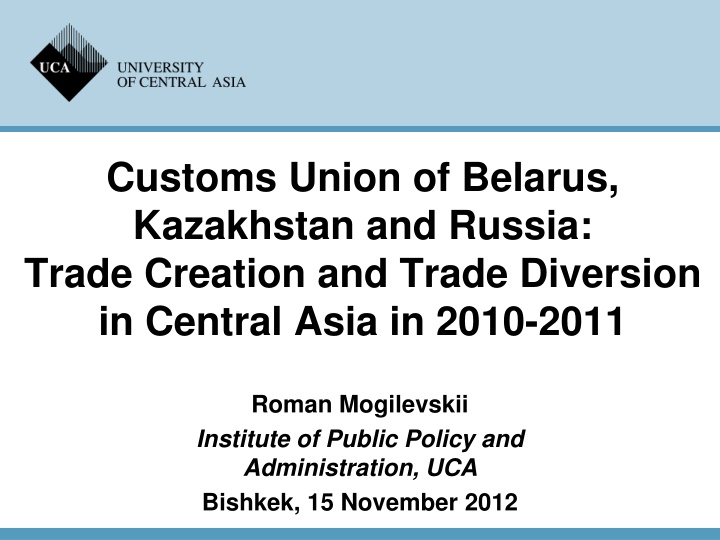
Customs Union of Belarus, Kazakhstan and Russia: Trade Creation and Trade Diversion in Central Asia in 2010-2011 Roman Mogilevskii Institute of Public Policy and Administration, UCA Bishkek, 15 November 2012
Introduction The issue of the CU creation and operations is big in the current policy discussions in the region and in the news Major growth of trade between Russia and Kazakhstan (turnover 28% ) and between CU and other CA countries (turnover 19% ) has been reported in 2011 Is this growth due to the CU? This is the main question addressed in the paper Trade between (i) Kazakhstan and other CU members, (ii) Kazakhstan and other CA countries, and (iii) other CA countries and other CU countries Reservation it is still early days of the CU, many potential effects had no time to materialize yet
Key facts on the Customs Union Kazakh-Russian trade is concentrated on energy, metals and, in the case of Russian exports, manufactured products Kazakh-Belorussian trade is relatively small Formal free trade regime with other CA countries has not changed Trade between Kazakhstan and non-CU CA countries is concentrated on energy, cereals, and agricultural products Trade between Russia and non-CU CA countries is concentrated on energy, machinery, agricultural and light industry products
Expectations from the CU Two major effects of regional trade agreements trade creation and trade diversion Few studies on the impact of the CU on its members and neighbours CU effect on Kazakhstan depends on the success in improvement in Kazakh-Russian trade facilitation If this improvement is achieved, substantial trade creation and positive welfare effects If no improvement is achieved, Kazakh imports diversion from non-CU countries to other CU members and possibly CA countries accompanied by welfare losses
Measurement of trade creation/diversion Analysis of country trade shares - Increase in share of a CU member country in other members total exports/imports may signal trade diversion if accompanied by a decline in trade with non- CU countries, or trade creation if no decline is observed Apart from the changes in trade policy, exports/imports depend on international commodity prices, domestic demand changes in trading countries etc. Country shares allow accounting for these factors Trade is disaggregated to eight types of commodities: (i) energy, (ii) metals, (iii) cereals and flour, (iv) other agricultural products and foods, (v) chemicals and plastics, (vi) light industry products, (vii) machinery, and (viii) other products
Dynamics of commodity prices in 2011 1000 868 900 800 700 US dollars/ton 600 442 500 380 400 283 2010 300 143 200 2011 62 56 26 100 0 Coal Iron ores and concentrates (20% of KAZ exports to RUS) Crude oil (15% of KAZ imports from RUS) Oil products (8% of KAZ imports from RUS) (19% of KAZ exports to RUS)
Imports of articles of steel to Kazakhstan 4 800 4 200 3 600 3 000 Million US$ 2 400 1 800 1 200 600 0 2006 2007 2008 2009 2010 2011 Russia Ukraine China Other countries
Trade creation/diversion evidence Imports of Kazakhstan Commodity Partners Trade creation Russia and Other CA China Rest of the group (TC)/trade Belarus countries world diversion (TD) 2010 2010 2011 2010 2011 2010 2011 2010 -11 2011 2011 Energy Metals Agr. products & 20 -9 -277 -1002 14 290 TC TC 5 25 foods Chemicals 10 TC TC 46 215 &plastics Light industry 5 72 Machinery 176 TD 643 891 -1660
Trade creation/diversion evidence (2) Exports of Kazakhstan Commodity Partners Trade creation Russia and Other CA China Rest of the group (TC)/trade Belarus countries world diversion (TD) 2010 2010 2011 2010 2011 2010 176 34 2011 3894 475 2010 2011 2011 Energy Metals Agr. products & 1116 129 -36 -71 48 110 -33 foods Chemicals & TD 9 -16 plastics Light industry -86 TD 67 -35 -77 Machinery -83 TC 33
Trade creation/diversion evidence (3) Trade of other CA countries with Russia & Belarus Commodity group Exports to Russia and Imports from Russia Belarus and Belarus 2010 2011 2010 2011 Energy 140 435 Metals and ores 3 11 Agricultural products and foods -117 36 Chemicals and plastics 15 Light industry products 50 17 Machinery -37 -213 Other products 327
Trade creation/diversion evidence (4) Trade creation in Russian exports of chemicals and plastics, agricultural products and foods to Kazakhstan and the Kazakh exports of computers to Russia Large case of trade diversion in machinery imports to Kazakhstan Minor case of transition from exports of semi-fabricated product (leather) to exports of higher-value-added product (leather footwear) Minor case of conversion of previously informal imports/re-exports from China into formal import/export flows Possible small diversion of exports of the Russian vehicles from OCAC to Kazakhstan as well as exports of OCAC apparel to Russia
Trade creation/diversion evidence (5) Imports of passenger cars to Kazakhstan 100% 90% Other countries 80% 70% Uzbekistan 60% Russia 50% 40% USA 30% Germany 20% 10% Japan 0% 2007 2009 2011
CUs impact on informal trade flows Direct and indirect (via Kyrgyzstan) informal imports of Chinese consumer goods to Kazakhstan and Russia are worth of many USD billion Major changes in border crossing regime for physical persons on Kazakh-Kyrgyz border in April 2010 and in July 2011 Informal trade diversion in 2010-2011 Exports of Chinese light industry products to: Kazakhstan Kyrgyzstan Russia 2009 2010 USD billion 2011 3.74 4.19 5.76 4.73 3.13 9.11 4.46 3.66 10.76
Other economic changes in Kazakhstan Only rapid assessment Possible effect on trade in services, investments, prices, government revenue, employment Significant gain of the GoK budget in import duty revenue US$1.4 billion 18 16 % of total imports of goods 14 12 10.9 10 9.6 8 10.9 9.7 6 4 5.8 4.6 2 2.1 2.0 0 2008 2009 2010 2011 Import duties VAT on imports No other significant changes
Conclusions Major increases in the intra-CU trade and in trade between the CU and other CA countries are due to the growth of energy and metal prices Few small cases of creation of trade between Kazakhstan and Russia Large case of trade diversion with Kazakhstan s imports of machinery shift from developed countries to China and Russia possible welfare loss Few other minor trade changes attributable to the CU effects
Conclusions (2) Significant CU-attributable gain for the government budget of Kazakhstan Cumulative effect of the CU on the economy of Kazakhstan seems to be ambiguous CU impact on other CA countries is small with minor gains for Uzbekistan Actual effect of the CU so far is well below expectations General assessment of the CU effects is not going to be unambiguously positive or negative; there are winners and losers in each country; accounting for details and nuances seem to be necessary
