The Influence of Molecular Weight on Polymer Flow Behavior
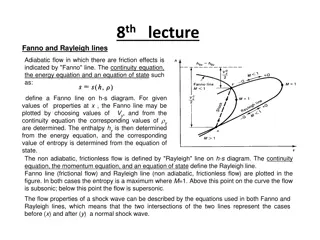
Molecular weight plays a critical role in determining the flow behavior of polymers above their glass transition temperature or melting point. The zero shear viscosity of polymers is directly related to their molecular weight, with significant changes in viscosity observed even with small differences in molecular weight. Rheological measurements are ideal for studying these effects, with implications for polymer processing and product characteristics.

Download Presentation

Please find below an Image/Link to download the presentation.
The content on the website is provided AS IS for your information and personal use only. It may not be sold, licensed, or shared on other websites without obtaining consent from the author.If you encounter any issues during the download, it is possible that the publisher has removed the file from their server.
You are allowed to download the files provided on this website for personal or commercial use, subject to the condition that they are used lawfully. All files are the property of their respective owners.
The content on the website is provided AS IS for your information and personal use only. It may not be sold, licensed, or shared on other websites without obtaining consent from the author.
E N D
Presentation Transcript
3rdYear Assist. Lecturer. AbbasAlbawee. Lecture: 4. (2018/2019) Polymers University of Diyala. College of Engineering. Department of Materials Eng. EFFECT OF MOLECULAR STRUCTURE AND MORPHOLOGY MolecularWeight Molecular weight is the main structural parameter of polymers flow behavior at temperatures above the glass transition temperature (for an amorphous material) or the melting point (for a semi-crystalline polymer). Melt viscosity is a constant at low shear rates or frequencies. The viscosity in this region is known as the zero shear, or Newtonian, viscosity ho. For low molecular weight polymers in which chain entanglement is not a factor, the zero shear viscosity is proportional to the polymer s molecular weight. ITowever, above a critical molecular weight, chains begin to entangle and the zero shear viscosity depends much stronger on molecular weight, proportional now to about the 3.4 power of the molecular weight. This is shown in Figure below. Rheological measurements are therefore ideal for studying the effects of molecular weight differences in resins as small differences in molecular weight are manifested in large changes in viscosity. 1/ from13
3 Year, PlasticEngineering. Ass. Prof. Dr. Nabel Kadum. Lecture: 13. University ofAl-Qadisiyah. College of Engineering. Department of Materials Eng. (2017/2018) The zero shear viscosity is a sensitive measure of poiymer moiecuiar weight, the reiationshipforfiexibie inear poiymers is no Molecular Weight Distribution Beyond the Newtonian region, melt viscosity drops with increasing shear rate, a phenomenon called shear thinning. This behavior is considered the most important non-Newtonian property in polymer processing because it speeds up material flow and reduces heat generation and energy consumption during processing. At constant molecular weight, the amount of energy required to process the polymer is directly related to the viscosity s shear rate dependence. The onset and degree of shear thinning vary among materials and qualitatively correlate with the molecular weight distribution: Polymers with a broad distribution tend to thin more at lower shear rates than those with a narrow distribution at the same average Mw. (see figure below,). 2/ from13
3rdYear, Plastic Engineering, Ass. Prof. Dr. Nabel Kadum. Lecture: 13. (2017/2018) University ofAl-Qadisiyah. College of Engineei ing. Department of Materials Eng. Molecular weight distribution differences In polymer melts are easily detected by measuring the complex viscosity n* as a function of freguency. Some important consequences of this: molding and extrusion can for example be made easier by broadening a polymer s molecular weight distribution finished product characteristics, such as sag and haze in blown LDPE films, or surface smoothness in a variety of thermoplastic molded goods can be altered by changing molecular weight distribution. The slope of the modulus versus the frequency curve for a me.1t also mirrors changes due to molecular weight distribution. Isothermal measurements of the modulus at frequencies below one reciprocal second show marked increases in the storage modulus as distribution is broadened. Such changes have been used to distinguish between good and poor performing products and guide subsequent product improvements through adjustments in molecular weight distribution (Figure below). 3/ from13
3rdYear, Plastic Engineering, Ass. Prof. Dr. Nabel Kadum. Lecture: 13. (2017/2018) University ofAl-Qadisiyah. College of Engineei ing. Department of Materials Eng. Frequency a [rads] Moiecuar weight distribution differences In polymer melts show best In the terminal region of the storage modulus G'. A good indicator of MWD changes is the cross over modulusGc. Branching Polymer chain branches can vary in number, length and distribution along the main chain. Increasing the number, the size, or the flexibility of the branches changes the melt viscosity. But if the branches are few and long enough to entangle, melt viscosity will be higher at low flequency than that of a corresponding linear polymer of the same molecular weight (Figure below). The viscosity of long-branched polymers is more shear rate dependent than is the viscosity of linear polymers and long chain branching affects the elasticity of the polymer melts which shows in the normal stress difference and the storage modulus. 4/ from13
3rdYear, Plastic Engineering, Ass. Prof. Dr. Nabel Kadum. Lecture: 13. (2017/2018) University ofAl-Qadisiyah. College of Engineei ing. Department of Materials Eng. -3 11 10 0 10 - -G" 250 000 broad G' 220 000 -o G" 220 000 broad - n* 250 000 F r-eoq u e0n0c0y 2(O20[ r *adbsroad 0< broad - 01 10 broad Effect of branching on the complex viscosity n* and the dynamic moduli G', G"" The extension viscosity at high strains increases strongly with long chain branches. Figure below compares the rheological responses of a long chain branched LDPE and a linear LLDPE in elongation. The pronounced viscosity increase at large elongation strains (strain hardening) is characteristic for long chain branching. Elongation viscosity of LDPE (branched) and LLDPE (linear) show pronounced differences at high total strains, rhls strain hardening effect Is a characteristic feature of long chain branching 5/ from13
University ofAl-Qadisiyah. College of Engineering. Department of Materials Eng. 3' Year, Plastic Engineering. Ass. Prof. Dr. Nabel Kadum. Lecture: 13. (2017/2018) Fillers Adding fillers to a neat polymer melt changes its rheology, influencing both the way the melt processes and the properties of the ultimate product. Key factors are filler size and shape, filler concentration, and the extent of any interactions among the particles. The consequences of adding fillers are an increase in melt viscosity and a decrease in die swell. Moreover do particle interactions increase the non-Newtonian range and cause it to occur at a lower shear rate than for the unfilled polymer melt. Filled polymers have a higher viscosity at low shear rates, and yielding may occur with increased filler concentration (Figure below). At higher shear rates the effect of the filler decreases and the matrix contributions dominate. Another effect of the filler is the reduction of the linear viscoelastic range, characterized by the onset of the strain dependent behavior. The viscosity of a highly filled LDPE exhibits yielding at low shear rates 6/ from13
University ofAl-Qadisiyah. College of Engineering. Department of Materials Eng. 3"' Year, Plastic Engineering. Ass. Prof. Dr. Nabel Kadum. Lecture: 13. (2017/2018) Blends Polymer blends are compositions of chemically different polymers. Polymer blends are homogeneous if the components are compatible and mix at molecular level. Blends are heterogeneous or incompatible if the components are present in separate phases. Usually the minor component is dispersed in a matrix of the dominant component. Whether a blend is compatible or not, also depends on temperature; in this case the blend is considered partially miscible. If blends are incompatible, mechanical energy is needed to disperse the minor phase (mixing) and coalescence occurs if the blend morphology is not stabilized. Interfacial forces such as the interfacial tension become important and can change the rheological signature of the blend significantly. Moreover, the elastic properties of non-compatible blends depend on energy storage mechanisms at the interphase. The relaxation of the dispersed phase itself is often much longer than the relaxation of the polymer chains of the individual components. Figure below shows the dynamic spectrum of a PMMA/PS blend with different volume fractions of the minor phase2. The additional low frequency contributions in G are due to the form relaxations of the large dispersed domains of the minor phase. If the average droplet size is known (from TEM for 7/ from13
University ofAl-Qadisiyah. College of Engineering. Department of Materials Eng. 3' Year, Plastic Engineering. Ass. Prof. Dr. Nabel Kadum. Lecture: 13. (2017/2018) example), the interfacial tension can be calculated from the average relaxation time of the droplet relaxation. 10 Frequency M [rad/s] The increase contributions of G' at low frequency can be used to calculate the Interfaclal tension of non-compatible blends 01 10 10' 10 10 0 0 0 Blending also provides a means to modify the elastic modrrlrrs. Pressrrre sensitive adhesives PSA have the best adhesion properties when the modulus is between 5x10⁵ and 105 Pa at rrse temperatrrre. By varying the content of tackifying resins in a natural or synthetic rrrbber matrix, the modulus can be adjusted as required 8/ from13
University ofAl-Qadisiyah. College of Engineering. Department of Materials Eng. 3' Year, Plastic Engineering. Ass. Prof. Dr. Nabel Kadum. Lecture: 13. (2017/2018) Comparison of PSA adhesive based on naturai rubber and SiS copoiymers. the SiS- based adhesive exhibits a wider appiication window (constant G'= 105 Pa) Process flows induce orientation of the dispersed phase in non-compatible blends. As a result of this fact, the morphology can be modified to change the final product specific properties: a good example is the improved gas barrier in blow molded beverage bottles. Since non-compatible blends undergo coalescence in the melt state, compatibalizers such as copolymers are added to stabilize the morphology. Another technique to stabilize the morphology is reactive blending, which involves in situ chemical reactions at the interphase. Viscosity & Density Measurement for Polymer Melts The viscosity is the resistance of a substance to flow, e.g. is a measure of the resistance of a fluid to deformation under shear stress. There are two main types of the viscosity, the kinematic 9/ from13
University ofAl-Qadisiyah. College of Engineering. Department of Materials Eng. 3' Year, Plastic Engineering. Ass. Prof. Dr. Nabel Kadum. Lecture: 13. (2017/2018) viscosity and dynamic viscosity. The dynamic viscosity, which sometime is referred as an absolute viscosity, is obtained by dividing the shear stress by the rate of shear strain. The kinematic viscosity is the measure of the rate at which momentum is transferred through a fluid. It may be obtained from the dynamic viscosity dividing it by the density of the substance. Density is a physical property of matter that expresses a ratio of mass to volume. The density depends on the atomic mass of an element or compound. Since different substances have different densities, density measurements are very useful for identification and characterization of different substances. The density and viscosity of polymer melts are very important physicochemical parameters in a polymer manufacturing process. They are very significant factors affecting the production cost and profitability of the manufacturing process. A reduction in the density reduces costs of raw materials and correspondingly costs of manufacturing. The viscosity measurement methods The viscosity parameter in chemical engineering processes. Many studies have is a very important physicochemical been done on measuring viscosity by using different techniques. The main, viscosity measurement methods are the following: 1. Viscometermethods: - Rotational viscometric method. 10/ from13
University ofAl-Qadisiyah. College of Engineei ing. Department of Materials Eng. 3 d Year, Plastic Engineering. Ass. Prof. Dr. Nabel Kadum. 'Lecture: 13. (2017/2018) - Capillary viscometric method. - Vibratory viscometric method. 2. Ultrasonic pulse echo method. Measuring viscosity in polymer melt The rheological behavior of most polymeric materials is very complex. A particularly difficult situation is in the case of polymer melts. Usually the viscosity must be measured in very complicated conditions- at high pressure (50-100) MPa and high temperature (about 150-300 oc ). This reduces the accuracy and reliability of measurements. Often the polymer viscosity is measured off-line, where a sample of the polymer compound is melted and put into a special capillary tube (glass viscometer) or by incorporating a capillary tube mounted parallel to the extruder for in-line measurements. The measurements performed by the glass viscometer require quite a lot of time to melt the sample and large volume of the samples. Both techniques involve an additional time delay requested for the melt to flow through the transit lines and the capillary tube. Sometimes the viscometers are mounted orr the extrusion line and measure the stress on the die wall by measuring the pressure drop along a slit or capillary. The flow rate is measured by an additional flow meter. These methods are more appropriate to the extrusion process, but there are some 11/ from13
University ofAl-Qadisiyah. College of Engineering. Department of Materials Eng. 3' Year, Plastic Engineering. Ass. Prof. Dr. Nabel Kadum. Lecture: 13. (2017/2018) major drawbacks. The flow meter may disturb the melt flow and correspondingly to affect the original flow properties. The presented methods do not satisfy requirements for on- line monitoring of polymer melts in the conditions characteristic during manufacturing process (high pressure, high temperature, the measurements in real time, aggressive environment). The melt viscosity can't be effectively monitored and measured with a good accuracy. So, it can be assumed, that the most appropriate method to measure the viscosity of a polymer melt is ultrasonic pulse echo method. This method is analyzed separately from other methods, because it is in many aspects superior in comparison to other techniques. The viscosity of polymer melts should be measured in real-time during extrusion process. The ability to measure the viscosity of polymer melts in-line during extrusion process provides the manufacturers with the ability to optimize their production. Measuring density in polymer melt Density is a very important physical parameter in polymer engineering processes. The density is a very significant factor affecting a production cost and profitability of the manufacturing process. Areduction in a density reduces the raw material cost and therefore decreases the manufacturing costs. So, it is very important to measure the density of polymer melt with a good 12/ from13
University ofAl-Qadisiyah. College of Engineering. Department of Materials Eng. 3' Year, Plastic Engineering. Ass. Prof. Dr. Nabel Kadum. Lecture: 13. (2017/2018) accuracy during the extrusion processes. The density of a polymer melt can be measured by densymeters, pycnometers and mass flow meters. The most commonly used densymeters and mass flow meters are based on the principle of vibrating tubes, for example Coriolis flow meters. These meters have major drawbacks. They are limited to pipe diameters below 60 mm and high pressure losses during the measurements occur. These meters are expensive and not stable, particularly when measurements in polymer melts must be performed at high pressure and temperature. So, it can be suggested, that the most appropriate method to measure the density in polymer melt may be ultrasonic pulse echo method. 13/ from13