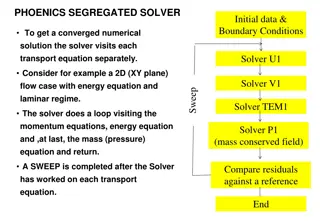
The Effectiveness of Instructional Games and Simulations

undefined
 
MEASURING
EFFECTIVENESS OF
INSTRUCTIONAL
GAMES AND
SIMULATIONS
 
RODNEY D. MYERS, PH.D.
INDEPENDENT SCHOLAR
 
THEODORE W. FRICK, PH.D.
PROFESSOR EMERITUS, INDIANA UNIVERSITY
 
 
1
 
INTRODUCTION
 
U
s
i
n
g
 
A
n
a
l
y
s
i
s
 
o
f
 
P
a
t
t
e
r
n
s
 
i
n
 
T
i
m
e
 
(
A
P
T
)
 
t
o
 
m
e
a
s
u
r
e
 
a
n
d
 
a
n
a
l
y
z
e
i
n
t
e
r
a
c
t
i
o
n
s
 
w
i
t
h
 
a
 
s
e
r
i
o
u
s
 
g
a
m
e
.
O
v
e
r
v
i
e
w
 
o
f
 
A
P
T
Comparison with traditional methods
Examples and explanations
Q
u
a
n
t
i
t
a
t
i
v
e
 
R
e
s
e
a
r
c
h
 
S
t
u
d
y
The Diffusion Simulation Game
 and diffusion of innovations
theory
Using APT for summative assessment of a group’s data
 
C
o
n
c
l
u
d
i
n
g
 
R
e
m
a
r
k
s
 
2
 
COMPARE THESE
FINDINGS
 
 
A
n
a
l
y
s
i
s
 
o
f
 
P
a
t
t
e
r
n
s
 
i
n
 
T
i
m
e
 
(
A
P
T
)
:
 
S
t
u
d
e
n
t
s
 
i
n
e
l
e
m
e
n
t
a
r
y
 
s
c
h
o
o
l
s
 
a
r
e
 
a
b
o
u
t
 
1
3
 
t
i
m
e
s
 
m
o
r
e
 
l
i
k
e
l
y
t
o
 
b
e
 
o
f
f
-
t
a
s
k
 
d
u
r
i
n
g
 
n
o
n
-
i
n
t
e
r
a
c
t
i
v
e
 
c
l
a
s
s
r
o
o
m
i
n
s
t
r
u
c
t
i
o
n
,
 
w
h
e
n
 
c
o
m
p
a
r
e
d
 
w
i
t
h
 
t
h
e
i
r
 
e
n
g
a
g
e
m
e
n
t
d
u
r
i
n
g
 
i
n
t
e
r
a
c
t
i
v
e
 
i
n
s
t
r
u
c
t
i
o
n
.
 
L
i
n
e
a
r
 
M
o
d
e
l
s
 
A
p
p
r
o
a
c
h
 
(
L
M
A
)
:
 
T
h
e
 
a
m
o
u
n
t
 
o
f
i
n
t
e
r
a
c
t
i
v
e
 
c
l
a
s
s
r
o
o
m
 
i
n
s
t
r
u
c
t
i
o
n
 
p
r
e
d
i
c
t
s
 
3
2
 
%
 
o
f
t
h
e
 
v
a
r
i
a
n
c
e
 
i
n
 
s
t
u
d
e
n
t
 
t
a
s
k
 
e
n
g
a
g
e
m
e
n
t
,
 
l
e
a
v
i
n
g
6
8
 
%
 
o
f
 
t
h
e
 
v
a
r
i
a
n
c
e
 
u
n
e
x
p
l
a
i
n
e
d
.
 
T
h
e
s
e
 
r
e
s
u
l
t
s
 
a
r
e
 
b
a
s
e
d
 
o
n
 
t
h
e
 
s
a
m
e
 
c
l
a
s
s
r
o
o
m
o
b
s
e
r
v
a
t
i
o
n
 
d
a
t
a
 
(
s
e
e
 
F
r
i
c
k
,
1
9
9
0
)
.
 
3
 
WHAT’S THE
DIFFERENCE?
 
The short answer:
APT 
measures the relation
.
LMA 
relates the measures
.
Why is this important?
When we make 
separate
 measures of
phenomena we have only independent
measures to associate.
We can do only traditional analysis of
associations, such as Pearson correlations,
multiple regression, ANOVA, etc.
 
4
 
WHAT’S THE
DIFFERENCE?
 
In APT, temporal patterns are observed and coded.
APT queries directly count patterns in temporal
maps.
There is no way to derive these pattern counts from
separate measures of phenomena, as done in the
Linear Models Approach (LMA).
 
5
 
WHAT’S THE
DIFFERENCE (CONT’D)
 
“The mathematical conclusion is that there is no way to
uniquely determine the joint probability distribution given only
the marginal probability distributions...” (Frick, 1984, p. 79)
The LMA is handicapped, as was Humpty Dumpty after falling
from the wall:
We cannot reconstruct the relations of those pieces to
each after Humpty Dumpty fell (we cannot “put Humpty
Dumpty together again”)
We are limited to counting the separate pieces on the
ground, not their relations to each other.
We refer to this problem as “aggregation aggravation.”
M
a
y
b
e
 
w
e
 
s
h
o
u
l
d
 
i
n
s
t
e
a
d
 
c
a
l
l
 
i
t
 
t
h
e
 
H
u
m
p
t
y
 
D
u
m
p
t
y
E
f
f
e
c
t
.
 
6
 
MEDICAL SCIENCE
AND DIET EXAMPLE
 
L
i
n
e
a
r
 
M
o
d
e
l
s
 
A
p
p
r
o
a
c
h
C
o
n
s
u
m
p
t
i
o
n
 
o
f
 
l
e
s
s
 
o
v
e
r
a
l
l
 
c
a
l
o
r
i
e
s
 
i
s
a
s
s
o
c
i
a
t
e
d
 
w
i
t
h
 
w
e
i
g
h
t
 
l
o
s
s
.
Total calories consumed and weight are
measured 
separately
.
Conclusion:  eat less calories to lose weight.
Problems:
Does not work in practice, cannot be sustained
long-term due to persistent hunger.
Correlation does not imply causation.
 
7
 
MEDICAL SCIENCE AND
DIET EXAMPLE (CONT’D)
 
A
P
T
 
A
p
p
r
o
a
c
h
:
 
 
S
t
u
d
y
 
m
e
t
a
b
o
l
i
c
t
e
m
p
o
r
a
l
 
p
r
o
c
e
s
s
e
s
F
i
n
d
i
n
g
s
:
1.
When glucose is present in bloodstream, it is burned
1
st
 for energy.
2.
When no glucose is available, glycogen is burned
next.
3.
W
h
e
n
 
n
o
 
g
l
u
c
o
s
e
 
o
r
 
g
l
y
c
o
g
e
n
 
i
s
 
a
v
a
i
l
a
b
l
e
,
 
s
t
o
r
e
d
 
f
a
t
i
s
 
b
u
r
n
e
d
 
f
o
r
 
e
n
e
r
g
y
 
(
p
r
o
c
e
s
s
 
i
s
 
c
a
l
l
e
d
 
k
e
t
o
s
i
s
)
.
 
T
h
e
s
e
 
p
r
o
c
e
s
s
e
s
 
o
c
c
u
r
 
a
u
t
o
m
a
t
i
c
a
l
l
y
.
 
 
T
h
e
y
 
a
r
e
 
n
o
t
u
n
d
e
r
 
c
o
n
s
c
i
o
u
s
 
c
o
n
t
r
o
l
.
 
8
 
MEDICAL SCIENCE AND
DIET EXAMPLE (CONT’D)
 
T
e
m
p
o
r
a
l
 
P
a
t
t
e
r
n
s
:
 
 
W
H
E
N
 
c
a
r
b
o
h
y
d
r
a
t
e
s
 
a
r
e
 
c
o
n
s
u
m
e
d
,
T
H
E
N
 
N
E
X
T
 
t
h
e
y
 
a
r
e
 
c
o
n
v
e
r
t
e
d
 
t
o
 
g
l
u
c
o
s
e
.
 
 
W
H
E
N
 
t
o
o
 
m
u
c
h
g
l
u
c
o
s
e
 
i
s
 
p
r
e
s
e
n
t
,
 
T
H
E
N
 
i
t
 
i
s
 
s
t
o
r
e
d
 
a
s
 
f
a
t
 
A
N
D
 
m
e
t
a
b
o
l
i
c
p
r
o
c
e
s
s
 
2
 
a
n
d
 
3
 
d
o
 
n
o
t
 
o
c
c
u
r
 
A
N
D
 
w
e
i
g
h
t
 
i
n
c
r
e
a
s
e
s
.
W
h
e
n
 
t
h
e
 
i
n
t
a
k
e
 
o
f
 
c
a
r
b
o
h
y
d
r
a
t
e
s
 
i
s
 
d
e
c
r
e
a
s
e
d
 
t
o
 
4
0
 
g
r
a
m
s
o
r
 
l
e
s
s
 
a
 
d
a
y
,
 
a
n
d
 
e
n
o
u
g
h
 
p
r
o
t
e
i
n
 
a
n
d
 
f
a
t
s
 
a
r
e
 
e
a
t
e
n
 
t
o
p
r
e
v
e
n
t
 
h
u
n
g
e
r
,
 
s
u
s
t
a
i
n
e
d
 
k
e
t
o
s
i
s
 
o
c
c
u
r
s
.
S
u
s
t
a
i
n
e
d
 
k
e
t
o
s
i
s
 
l
e
a
d
s
 
t
o
 
w
e
i
g
h
t
 
l
o
s
s
.
 
 
I
t
 
w
o
r
k
s
!
Problems
Contradicts standard dietary advice based on LMA
LMA conclusions are based on separate measures of calories
and weight, and have led to incorrect inferences!
 
 
9
 
OVERVIEW OF MAPSAT
 
M
a
p
 
&
 
A
n
a
l
y
z
e
 
P
a
t
t
e
r
n
s
 
&
 
S
t
r
u
c
t
u
r
e
s
 
A
c
r
o
s
s
 
T
i
m
e
:
 
 
2
 
m
e
t
h
o
d
s
Analysis of Patterns in Time (APT)
Analysis of Patterns in Configuration (APC)
 
A
P
T
Different approach to measurement and analysis
Create a temporal map which characterizes temporal events
Look for temporal patterns within a map
Count them (event pattern frequency)
Estimate likelihood (relative frequency)
Aggregate time (event pattern duration)
Estimate proportion time (relative pattern duration)
 
10
10
 
HOW IS 
APT
DIFFERENT?
 
T
r
a
d
i
t
i
o
n
a
l
 
q
u
a
n
t
i
t
a
t
i
v
e
 
m
e
t
h
o
d
s
 
o
f
 
m
e
a
s
u
r
e
m
e
n
t
 
a
n
d
a
n
a
l
y
s
i
s
Obtain separate measures of variables for each case
Statistically analyze relations among measures
We 
relate measures
 
E
x
a
m
p
l
e
 
o
f
 
s
p
r
e
a
d
s
h
e
e
t
 
d
a
t
a
:
 
11
11
 
HOW IS 
APT
DIFFERENT?
 
A
n
a
l
y
s
i
s
 
o
f
 
P
a
t
t
e
r
n
s
 
i
n
 
T
i
m
e
Create temporal map for each case
Query temporal map for patterns
We 
measure relations 
directly
 
E
x
a
m
p
l
e
 
o
f
 
s
p
r
e
a
d
s
h
e
e
t
 
d
a
t
a
:
 
12
12
 
WHAT IS A TEMPORAL
MAP?
 
13
13
 
 
Example of temporal map of weather
 
CODEBOOK FOR
OBSERVING WEATHER
EVENTS
 
C
l
a
s
s
i
f
i
c
a
t
i
o
n
 
0
 
N
a
m
e
:
 
S
e
a
s
o
n
 
o
f
 
Y
e
a
r
Classification Value Type = Nominal
Number of categories (temporal event values) = 5
Category 0 = Null
Category 1 = Fall
Category 2 = Winter
Category 3 = Spring
Category 4 = Summer
 
C
l
a
s
s
i
f
i
c
a
t
i
o
n
 
1
 
N
a
m
e
:
 
A
i
r
 
T
e
m
p
e
r
a
t
u
r
e
Classification Value Type = Interval
Units of measure = degrees Fahrenheit
 
14
14
 
CODEBOOK FOR
OBSERVING WEATHER
EVENTS
 
C
l
a
s
s
i
f
i
c
a
t
i
o
n
 
2
 
N
a
m
e
:
 
B
a
r
o
m
e
t
r
i
c
 
P
r
e
s
s
u
r
e
Classification Value Type = Ordinal
Number of categories (temporal event values) = 3
Category 0 = Null
Category 1 = Above 30 psi
Category 2 = Below 30 psi
 
C
l
a
s
s
i
f
i
c
a
t
i
o
n
 
3
 
N
a
m
e
:
 
P
r
e
c
i
p
i
t
a
t
i
o
n
Classification Value Type = Nominal
Number of categories (temporal event values) = 4
Category 0 = Null
Category 1 = Rain
Category 2 = Sleet
Category 3 = Snow
 
 
15
15
 
QUERY A TEMPORAL
MAP:  EXAMPLE
 
Q
u
e
r
y
 
1
.
 
 
H
e
r
e
 
i
s
 
a
 
2
-
p
h
r
a
s
e
 
A
P
T
 
Q
u
e
r
y
:
W
H
I
L
E
 
t
h
e
 
F
I
R
S
T
 
J
o
i
n
t
 
T
e
m
p
o
r
a
l
 
E
v
e
n
t
 
i
s
 
t
r
u
e
 
(
P
h
r
a
s
e
 
1
)
:
Season of Year is in state 
starting or continuing
, value 
= Fall
Barometric Pressure is in state 
starting or continuing
, value 
= Below 30
Cloud Structure is in state 
starting or continuing
, value 
= Nimbus Stratus
Duration when Phrase 1 is True = 13,436 seconds (out of 19,584 seconds total). Proportion of Time =
0.68607
Joint Event Frequency when Phrase 1 is True = 12 (out of 18 total joint temporal events). Proportion of
JTEs = 0.66667
 
T
H
E
N
 
w
h
i
l
e
 
t
h
e
 
N
E
X
T
 
J
o
i
n
t
 
T
e
m
p
o
r
a
l
 
E
v
e
n
t
 
i
s
 
t
r
u
e
 
(
P
h
r
a
s
e
 
2
)
:
Season of Year is in state 
starting or continuing
, value 
= Fall
Barometric Pressure is in state 
starting or continuing
, value 
= Below 30
Precipitation is in state 
starting or continuing
, value 
= Rain
Cloud Structure is in state 
starting or continuing
, value 
= Nimbus Stratus
Duration when Phrase 2 is True = 4,086 seconds (out of 19,584 seconds total), given all prior phrases
are true. Proportion of Time = 0.20864
Joint Event Frequency when Phrase 2 is True = 3 (out of 18 total joint temporal events), given all prior
phrases are true. Proportion of JTEs = 0.16667
C
o
n
d
i
t
i
o
n
a
l
 
j
o
i
n
t
 
e
v
e
n
t
 
d
u
r
a
t
i
o
n
 
w
h
e
n
 
P
h
r
a
s
e
 
2
 
i
s
 
t
r
u
e
,
 
g
i
v
e
n
 
a
l
l
 
p
r
i
o
r
 
p
h
r
a
s
e
s
 
a
r
e
 
t
r
u
e
 
=
 
0
.
3
0
4
1
1
 
(
4
,
0
8
6
o
u
t
 
o
f
 
1
3
,
4
3
6
 
s
e
c
o
n
d
s
 
(
t
i
m
e
 
u
n
i
t
s
)
.
Conditional joint event 
frequency
 when Phrase 2 is true, given all prior phrases are true = 0.25000 (3
out of 12 joint temporal events).
 
16
16
 
RESULT OF QUERY FOR
APT
 PATTERN IN
TEMPORAL MAP
 
17
17
 
The 
conditional joint event duration of the 2-phrase
pattern
 specified in Query 1 becomes the 
measure
that is entered into the spreadsheet
 
Thus, the variable is the 
pattern specified Query 1
and its value is 
0.30
.
 
DEMO OF APT QUERIES
ON WEATHER PATTERNS
 
 
I
f
 
w
e
 
h
a
v
e
 
a
 
g
o
o
d
 
I
n
t
e
r
n
e
t
 
c
o
n
n
e
c
t
i
o
n
:
 
h
t
t
p
s
:
/
/
w
w
w
.
i
n
d
i
a
n
a
.
e
d
u
/
~
s
i
m
e
d
/
a
p
t
d
e
m
o
/
a
p
t
d
s
g
.
p
h
p
 
18
18
 
EXAMPLE OF 
APT
 TEMPORAL
MAP FOR THE 
DIFFUSION
SIMULATION GAME
 
 
I
f
 
w
e
 
h
a
v
e
 
a
 
g
o
o
d
 
I
n
t
e
r
n
e
t
 
c
o
n
n
e
c
t
i
o
n
:
 
h
t
t
p
s
:
/
/
w
w
w
.
i
n
d
i
a
n
a
.
e
d
u
/
~
s
i
m
e
d
/
a
p
t
m
u
l
t
i
m
a
p
/
a
p
t
d
s
g
S
u
m
m
a
r
y
.
p
h
p
 
S
h
o
w
 
a
 
c
o
u
p
l
e
 
o
f
 
m
a
p
s
.
D
o
 
a
 
c
o
u
p
l
e
 
o
f
 
q
u
e
r
i
e
s
.
 
19
19
 
THE 
DIFFUSION SIMULATION
GAME 
& DOI THEORY
 
20
20
 
R
e
s
e
a
r
c
h
 
S
t
u
d
y
:
 
U
s
i
n
g
 
A
P
T
 
f
o
r
 
S
e
r
i
o
u
s
 
G
a
m
e
s
 
A
n
a
l
y
t
i
c
s
 
2-Year
Calendar
Innovation-
Decision Phases
Staff Members
& Personal Info
Activities
 
USING APT TO ANALYZE
GAMEPLAY DATA
 
G
e
n
e
r
a
l
i
z
a
t
i
o
n
s
 
f
r
o
m
D
O
I
 
t
h
e
o
r
y
 
21
21
 
D
S
G
 
a
c
t
i
v
i
t
i
e
s
A
d
o
p
t
e
r
 
t
y
p
e
s
D
e
c
i
s
i
o
n
 
p
h
a
s
e
s
 
E
x
a
m
p
l
e
:
M
a
s
s
 
m
e
d
i
a
 
s
h
o
u
l
d
 
b
e
e
f
f
e
c
t
i
v
e
 
i
n
 
s
p
r
e
a
d
i
n
g
k
n
o
w
l
e
d
g
e
 
a
b
o
u
t
 
a
n
i
n
n
o
v
a
t
i
o
n
,
 
e
s
p
e
c
i
a
l
l
y
a
m
o
n
g
 
i
n
n
o
v
a
t
o
r
s
 
a
n
d
e
a
r
l
y
 
a
d
o
p
t
e
r
s
 
L
o
c
a
l
 
M
a
s
s
 
M
e
d
i
a
 
&
 
P
r
i
n
t
I
n
n
o
v
a
t
o
r
s
 
&
 
E
a
r
l
y
 
A
d
o
p
t
e
r
s
A
w
a
r
e
n
e
s
s
 
&
 
I
n
t
e
r
e
s
t
 
9
 
s
t
r
a
t
e
g
i
e
s
:
 
s
c
o
r
i
n
g
 
a
l
g
o
r
i
t
h
m
 
f
o
r
 
p
a
t
t
e
r
n
s
 
o
f
 
j
o
i
n
t
o
c
c
u
r
r
e
n
c
e
s
 
USING APT TO ANALYZE
GAMEPLAY DATA
 
Population
1,280 players, 2,679 games
28 players finished 10 or more games
Randomly selected 15 players for group
analysis (240 games, 11,913 turns)
 
22
22
 
GAME OUTCOMES
 
23
23
 
GAME OUTCOMES
 
24
24
 
 
GAME OUTCOMES
 
25
25
 
 
GAME OUTCOMES
 
26
26
 
 
EXAMPLE QUERY
 
27
27
 
Q
u
e
r
y
 
R
e
s
u
l
t
WHILE the FIRST Joint Temporal Event is true (Phrase 1):
T
u
r
n
 
i
s
 
i
n
 
s
t
a
t
e
 
s
t
a
r
t
i
n
g
 
o
r
 
c
o
n
t
i
n
u
i
n
g
,
 
v
a
l
u
e
 
<
=
 
1
5
T
a
r
g
e
t
 
E
a
r
l
i
e
r
 
A
d
o
p
t
e
r
 
i
s
 
i
n
 
s
t
a
t
e
 
s
t
a
r
t
i
n
g
 
o
r
 
c
o
n
t
i
n
u
i
n
g
,
 
v
a
l
u
e
 
=
 
T
r
u
e
 
Average conditional probability is 0.12112 and 
SD
 is 0.04778
Total 
frequency
 of JTEs = 2312 out of 19304
Overall
 proportion of JTEs = 0.11977
 
GROUP RESULTS
 
28
28
 
S
t
r
a
t
e
g
y
 
1
:
 
T
a
r
g
e
t
 
e
a
r
l
i
e
r
 
a
d
o
p
t
e
r
s
 
a
n
d
 
o
p
i
n
i
o
n
 
l
e
a
d
e
r
s
 
e
a
r
l
y
i
n
 
t
h
e
 
g
a
m
e
 
t
o
 
w
o
r
k
 
t
o
w
a
r
d
 
c
r
i
t
i
c
a
l
 
m
a
s
s
.
 
GROUP RESULTS
 
29
29
 
S
t
r
a
t
e
g
y
 
2
:
 
U
s
e
 
P
e
r
s
o
n
a
l
 
I
n
f
o
r
m
a
t
i
o
n
 
a
n
d
 
T
a
l
k
 
T
o
 
a
c
t
i
v
i
t
i
e
s
 
t
o
e
s
t
a
b
l
i
s
h
 
e
m
p
a
t
h
y
 
a
n
d
 
r
a
p
p
o
r
t
 
i
n
 
o
r
d
e
r
 
t
o
 
u
n
d
e
r
s
t
a
n
d
 
a
c
l
i
e
n
t
s
 
n
e
e
d
s
,
 
s
o
c
i
o
c
u
l
t
u
r
a
l
 
v
a
l
u
e
s
 
a
n
d
 
b
e
l
i
e
f
s
,
 
a
n
d
 
p
r
e
v
i
o
u
s
e
x
p
o
s
u
r
e
 
t
o
 
r
e
l
a
t
e
d
 
i
d
e
a
s
.
 
GROUP RESULTS
 
30
30
 
S
t
r
a
t
e
g
y
 
6
:
 
U
s
e
 
t
h
e
 
S
i
t
e
 
V
i
s
i
t
 
a
c
t
i
v
i
t
y
 
t
o
 
a
l
l
o
w
 
t
h
e
 
v
i
s
i
t
o
r
s
 
t
o
s
e
e
 
t
h
e
 
i
n
n
o
v
a
t
i
o
n
 
i
n
 
u
s
e
,
 
p
r
o
v
i
d
i
n
g
 
h
o
w
-
t
o
 
k
n
o
w
l
e
d
g
e
 
a
n
d
r
e
d
u
c
i
n
g
 
u
n
c
e
r
t
a
i
n
t
y
 
a
b
o
u
t
 
t
h
e
 
c
o
n
s
e
q
u
e
n
c
e
s
 
o
f
 
a
d
o
p
t
i
o
n
.
 
GROUP RESULTS
 
31
31
 
S
t
r
a
t
e
g
y
 
9
:
 
U
s
e
 
t
h
e
 
T
r
a
i
n
i
n
g
 
W
o
r
k
s
h
o
p
 
(
S
e
l
f
)
 
a
n
d
 
M
a
t
e
r
i
a
l
s
W
o
r
k
s
h
o
p
 
a
c
t
i
v
i
t
i
e
s
 
t
o
 
p
r
o
v
i
d
e
 
k
n
o
w
l
e
d
g
e
 
a
n
d
 
a
s
s
i
s
t
a
n
c
e
r
e
g
a
r
d
i
n
g
 
p
r
o
c
e
d
u
r
e
s
 
a
n
d
 
p
r
i
n
c
i
p
l
e
s
 
t
o
 
f
u
r
t
h
e
r
 
r
e
d
u
c
e
u
n
c
e
r
t
a
i
n
t
y
 
a
n
d
 
i
n
c
r
e
a
s
e
 
c
o
n
f
i
d
e
n
c
e
.
USING APT FOR FORMATIVE
ASSESSMENT DURING GAMEPLAY
32
32
 
S
u
m
m
a
t
i
v
e
Used by instructor and/or learner
Evidence of understanding and application
Analyze prior gameplay maps
Identify persistent misconceptions
F
o
r
m
a
t
i
v
e
Dynamic analysis of gameplay
Provide scaffolds (e.g., hints, coaching)
Requested by learner
Before turn: hint
After turn: explanation or prompt for reflection
USING APT FOR FORMATIVE
ASSESSMENT DURING GAMEPLAY
33
33
 
G
e
n
e
r
a
l
i
z
a
t
i
o
n
 
5
-
1
3
:
 
M
a
s
s
 
m
e
d
i
a
 
c
h
a
n
n
e
l
s
 
a
r
e
 
r
e
l
a
t
i
v
e
l
y
 
m
o
r
e
i
m
p
o
r
t
a
n
t
 
a
t
 
t
h
e
 
k
n
o
w
l
e
d
g
e
 
s
t
a
g
e
,
 
a
n
d
 
i
n
t
e
r
p
e
r
s
o
n
a
l
 
c
h
a
n
n
e
l
s
a
r
e
 
r
e
l
a
t
i
v
e
l
y
 
m
o
r
e
 
i
m
p
o
r
t
a
n
t
 
a
t
 
t
h
e
 
p
e
r
s
u
a
s
i
o
n
 
s
t
a
g
e
 
i
n
 
t
h
e
i
n
n
o
v
a
t
i
o
n
-
d
e
c
i
s
i
o
n
 
p
r
o
c
e
s
s
 
(
p
.
 
2
0
5
)
.
G
e
n
e
r
a
l
i
z
a
t
i
o
n
 
7
-
2
2
:
 
E
a
r
l
i
e
r
 
a
d
o
p
t
e
r
s
 
h
a
v
e
 
g
r
e
a
t
e
r
 
e
x
p
o
s
u
r
e
 
t
o
m
a
s
s
 
m
e
d
i
a
 
c
o
m
m
u
n
i
c
a
t
i
o
n
 
c
h
a
n
n
e
l
s
 
t
h
a
n
 
d
o
 
l
a
t
e
r
 
a
d
o
p
t
e
r
s
 
(
p
.
2
9
1
)
.
Poor use of
mass media
 
CONCLUDING REMARKS
 
34
34
 
U
s
i
n
g
 
P
a
t
t
e
r
n
 
M
a
t
c
h
i
n
g
 
t
o
 
A
s
s
e
s
s
 
G
a
m
e
p
l
a
y
(
C
h
a
p
t
e
r
 
1
9
)
L
o
h
,
 
C
.
 
S
.
,
 
S
h
e
n
g
,
 
Y
.
,
 
&
 
I
f
e
n
t
h
a
l
e
r
,
 
D
.
 
(
E
d
s
.
)
.
 
(
2
0
1
5
)
.
 
S
e
r
i
o
u
s
g
a
m
e
 
a
n
a
l
y
t
i
c
s
:
 
M
e
t
h
o
d
o
l
o
g
i
e
s
 
f
o
r
 
p
e
r
f
o
r
m
a
n
c
e
m
e
a
s
u
r
e
m
e
n
t
,
 
a
s
s
e
s
s
m
e
n
t
,
 
a
n
d
 
i
m
p
r
o
v
e
m
e
n
t
.
 
N
e
w
 
Y
o
r
k
,
 
N
Y
:
S
p
r
i
n
g
e
r
.
 
C
o
n
t
a
c
t
 
u
s
:
R
o
d
 
M
y
e
r
s
 
 
r
o
d
@
w
e
b
g
r
o
k
.
c
o
m
T
e
d
 
F
r
i
c
k
 
 
f
r
i
c
k
@
i
n
d
i
a
n
a
.
e
d
u
Slide Note
Embed
Share

This research delves into the use of Analysis of Patterns in Time (APT) to measure interactions in instructional games, comparing it with Linear Models Approach (LMA). Findings show that students are more engaged during interactive instruction. The significance lies in APT measuring relations while LMA relates measures, emphasizing the importance of observing temporal patterns directly. The limitations of traditional methods like Pearson correlations and multiple regression are highlighted, showcasing the unique insights offered by APT.

  • Instructional Games
  • Simulations
  • Educational Research
  • Engagement
  • Analysis of Patterns

Uploaded on Oct 08, 2024 | 0 Views


Download Presentation

Please find below an Image/Link to download the presentation.

The content on the website is provided AS IS for your information and personal use only. It may not be sold, licensed, or shared on other websites without obtaining consent from the author. Download presentation by click this link. If you encounter any issues during the download, it is possible that the publisher has removed the file from their server.

E N D

Presentation Transcript


  1. MEASURING EFFECTIVENESS OF INSTRUCTIONAL GAMES AND SIMULATIONS RODNEY D. MYERS, PH.D. INDEPENDENT SCHOLAR THEODORE W. FRICK, PH.D. PROFESSOR EMERITUS, INDIANA UNIVERSITY 1

  2. INTRODUCTION Using Analysis of Patterns in Time (APT) to measure and analyze interactions with a serious game. Overview of APT Comparison with traditional methods Examples and explanations Quantitative Research Study The Diffusion Simulation Game and diffusion of innovations theory Using APT for summative assessment of a group s data Concluding Remarks 2

  3. COMPARE THESE FINDINGS Analysis of Patterns in Time (APT): Students in elementary schools are about 13 times more likely to be off-task during non-interactive classroom instruction, when compared with their engagement during interactive instruction. Linear Models Approach (LMA): The amount of interactive classroom instruction predicts 32 % of the variance in student task engagement, leaving 68 % of the variance unexplained. These results are based on the same classroom observation data (see Frick,1990). 3

  4. WHATS THE DIFFERENCE? The short answer: APT measures the relation. LMA relates the measures. Why is this important? When we make separate measures of phenomena we have only independent measures to associate. We can do only traditional analysis of associations, such as Pearson correlations, multiple regression, ANOVA, etc. 4

  5. WHATS THE DIFFERENCE? In APT, temporal patterns are observed and coded. APT queries directly count patterns in temporal maps. There is no way to derive these pattern counts from separate measures of phenomena, as done in the Linear Models Approach (LMA). 5

  6. WHATS THE DIFFERENCE (CONT D) The mathematical conclusion is that there is no way to uniquely determine the joint probability distribution given only the marginal probability distributions... (Frick, 1984, p. 79) The LMA is handicapped, as was Humpty Dumpty after falling from the wall: We cannot reconstruct the relations of those pieces to each after Humpty Dumpty fell (we cannot put Humpty Dumpty together again ) We are limited to counting the separate pieces on the ground, not their relations to each other. We refer to this problem as aggregation aggravation. Maybe we should instead call it the Humpty Dumpty Effect. 6

  7. EXAMPLE OF APT TEMPORAL MAP FOR THE DIFFUSION SIMULATION GAME If we have a good Internet connection: https://www.indiana.edu/~simed/aptmulti map/aptdsgSummary.php Show a couple of maps. Do a couple of queries. 19

  8. THE DIFFUSION SIMULATION GAME & DOI THEORY Research Study: Using APT for Serious Games Analytics 2-Year Calendar Innovation- Decision Phases Activities Staff Members & Personal Info 20

  9. USING APT TO ANALYZE GAMEPLAY DATA Generalizations from DOI theory DSG activities Adopter types Decision phases Example: Local Mass Media & Print Innovators & Early Adopters Awareness & Interest Mass media should be effective in spreading knowledge about an innovation, especially among innovators and early adopters 9 strategies: scoring algorithm for patterns of joint occurrences 21

  10. USING APT TO ANALYZE GAMEPLAY DATA Population 1,280 players, 2,679 games 28 players finished 10 or more games Randomly selected 15 players for group analysis (240 games, 11,913 turns) 22

  11. GAME OUTCOMES Game Outcome Maximally Successful Highly Successful Moderately Successful Unsuccessful Adoption Points 220 166 219 146 165 0 - 145 Games (n=240) 12 71 81 76 23

  12. GAME OUTCOMES Player 5 3 2 1 0 1 2 3 4 5 6 7 8 9 10 11 12 24

  13. GAME OUTCOMES Player 10 3 2 1 0 1 2 3 4 5 6 7 8 9 10 11 25

  14. GAME OUTCOMES Player 9 3 2 1 0 1 2 3 4 5 6 7 8 9 10 11 12 13 14 15 16 17 18 19 26

  15. EXAMPLE QUERY Query Result WHILE the FIRST Joint Temporal Event is true (Phrase 1): Turn is in state starting or continuing, value <= 15 Target Earlier Adopter is in state starting or continuing, value = True Average conditional probability is 0.12112 and SD is 0.04778 Total frequency of JTEs = 2312 out of 19304 Overall proportion of JTEs = 0.11977 27

  16. GROUP RESULTS Strategy 1: Target earlier adopters and opinion leaders early in the game to work toward critical mass. Earlier Adopters Opinion Leaders 0.12112 0.07598 0.01641 4.63 0.09245 0.05569 0.01195 4.66 All High Low Ratio 28

  17. GROUP RESULTS Strategy 2: Use Personal Information and Talk To activities to establish empathy and rapport in order to understand a client s needs, sociocultural values and beliefs, and previous exposure to related ideas. Talk To 0.42881 0.07762 0.19132 0.41 High Rank 0.17012 All High Low Ratio 29

  18. GROUP RESULTS Strategy 6: Use the Site Visit activity to allow the visitors to see the innovation in use, providing how-to knowledge and reducing uncertainty about the consequences of adoption. Site Visit 0.04615 0.00487 0.02043 High Rank 0.05822 All High Low Ratio 0.24 30

  19. GROUP RESULTS Strategy 9: Use the Training Workshop (Self) and Materials Workshop activities to provide knowledge and assistance regarding procedures and principles to further reduce uncertainty and increase confidence. Training 0.02479 0.01513 0.00324 4.67 Materials High Rank 0.02924 0.01810 0.00393 4.61 0.31558 All High Low Ratio 31

  20. USING APT FOR FORMATIVE ASSESSMENT DURING GAMEPLAY Summative Used by instructor and/or learner Evidence of understanding and application Analyze prior gameplay maps Identify persistent misconceptions Formative Dynamic analysis of gameplay Provide scaffolds (e.g., hints, coaching) Requested by learner Before turn: hint After turn: explanation or prompt for reflection 32

  21. USING APT FOR FORMATIVE ASSESSMENT DURING GAMEPLAY Player 3 Un Hi Md Hi Mx Hi Overall 0.02 0.07 0.10 0.10 0.05 0.09 Poor use of mass media High 0.02 0.02 0.03 0.03 0.03 0.03 Low 0.00 0.05 0.05 0.08 0.03 0.06 Generalization 5-13: Mass mediachannels are relatively more important at the knowledge stage, and interpersonal channels are relatively more important at the persuasion stage in the innovation-decision process (p. 205). Generalization 7-22: Earlier adopters have greater exposure to mass media communication channels than do later adopters (p. 291). 33

  22. CONCLUDING REMARKS Using Pattern Matching to Assess Gameplay (Chapter 19) Loh, C. S., Sheng, Y., & Ifenthaler, D. (Eds.). (2015). Serious game analytics: Methodologies for performance measurement, assessment, and improvement. New York, NY: Springer. Contact us: Rod Myers rod@webgrok.com Ted Frick frick@indiana.edu 34

Related


More Related Content

giItT1WQy@!-/#giItT1WQy@!-/#giItT1WQy@!-/#giItT1WQy@!-/#giItT1WQy@!-/#giItT1WQy@!-/#