Teaching AP Statistics Through Sports: The Moneyball Effect
Explore the innovative approach of using sports to teach AP Statistics through real-world examples and engaging activities. Discover how statistical inference is applied to sports scenarios, like analyzing player performances and conducting experiments to make data-driven decisions. Embrace a unique learning experience that combines sports passion with statistical concepts for a comprehensive educational journey.
Download Presentation

Please find below an Image/Link to download the presentation.
The content on the website is provided AS IS for your information and personal use only. It may not be sold, licensed, or shared on other websites without obtaining consent from the author. Download presentation by click this link. If you encounter any issues during the download, it is possible that the publisher has removed the file from their server.
E N D
Presentation Transcript
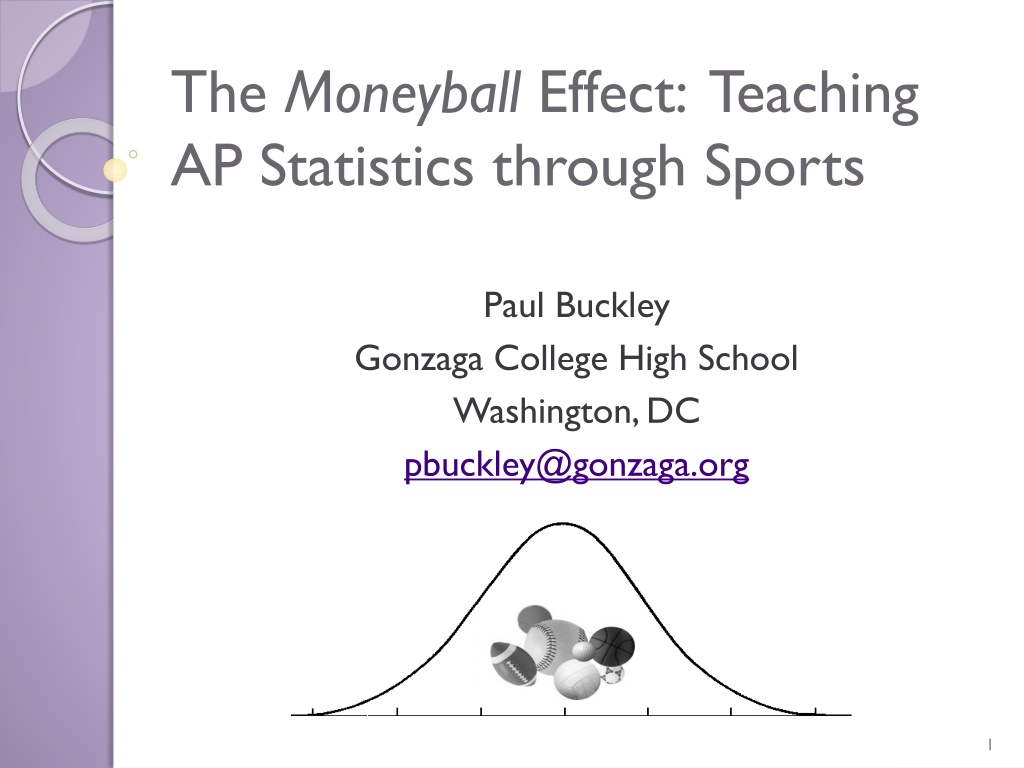
The Moneyball Effect: Teaching AP Statistics through Sports Paul Buckley Gonzaga College High School Washington, DC pbuckley@gonzaga.org 1
Why? Growth of Statistics 2
So how can Sports help us learn AP Statistics? 4
Statistical Inference Through Sports Miguel Cabrera vs Austin Jackson Who is really responsible for Detroit s success? 5
Two-Proportion Z Test pMC=proportion of hits for Miguel Cabrera for the entire season pAJ=proportion of hits for Austin Jackson for the entire season H0: pMC- pAJ=0 HA: pMC- pAJ>0 6
The Data pMC= proportion of hits for Miguel Cabrera in a random sample of 18 at-bats pAJ= proportion of hits for Austin Jackson in a random sample of 11 at-bats pMC=8 pAJ=0 17 11 7
Simulate the Games StatKey Fathom 8
Simulation results Likelihood = p-value 9
Experimental Design Through Sports Which is the better putter? 11
The Experiment Control putter, ball, course , swing Randomization prevent hot hand Easier to identify the response variable and what would affect it Replication Blinding Blocking 12
Experimental Design Through Sports c2 Which is the better putter? 13
Regression Through Sports Moneyball scene: http://www.youtube.com/watch?v=yGf6LNWY 9AI 14
Regression Through Sports Offense vs Defense Which is the better predictor of wins? 15
r = 0.7296 r = 0.7993 s=1.884 s=2.144 16
Think of the possibilities Soccer: Free Kicks vs Goals Hockey: Power Plays vs Goals Golf, which is a better predictor of success, greens in regulation or number of putts? Tennis: unforced errors or 1st serve percentage vs points won 17
What else? Putting together a relay team (track, swimming) lesson in z-scores, normal distributions Game strategies situational hitting conditional probabilities Layups vs jumpers vs 3-pointers non- linear regression And ? 18
