TCP Data Plane Performance Diagnosis Research

Dapper: Data Plane
Performance Diagnosis of TCP
Mojgan Ghasemi
Princeton University
Theophilus Benson
Jennifer Rexford
Duke University
Princeton University


1

The Move to Public Clouds
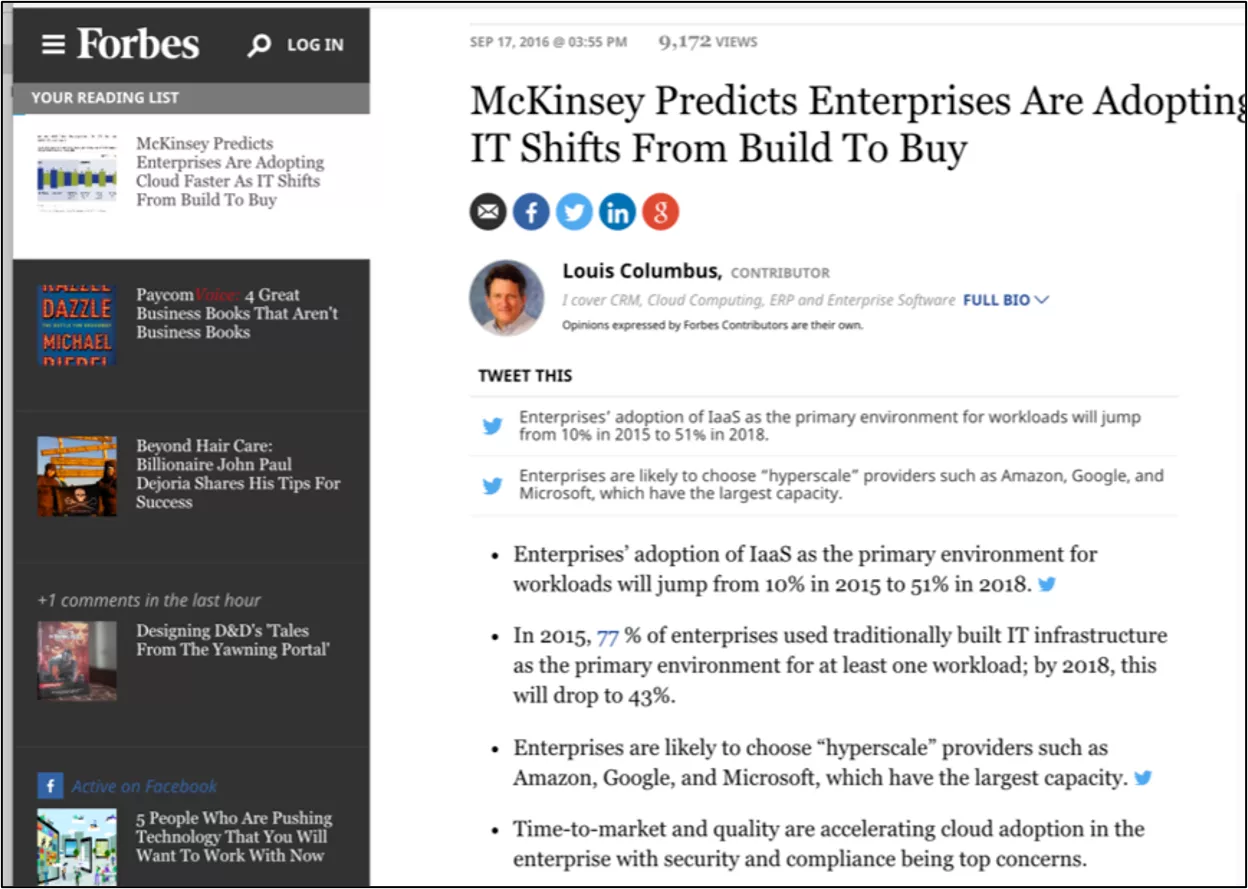
Public Clouds
3
•
Public cloud operators need:
•
High utilization (to reduce cost)
•
Good performance (to satisfy tenants)
•
Detecting, diagnosing, and fixing performance problems quickly is crucial!
Sources of Poor TCP Performance
•
Identifying the component is the most time-consuming and expensive part
•
Our goal:
quickly pinpoint the component impairing TCP performance
Not
backlogged!
Send buffer
too small
High RTT
High Loss
Low BW
Receive
buffer is full
Delayed ACK
4
Segment size,
MSS, App
reaction time
Congestion
window,
RTT, loss
Receive
window,
delayed ACK
Location of Performance Monitoring
Violates trust in
IaaS cloud,
Complicates
billing
No visibility into
e2e metrics,
Different paths for
packet stream
Compatible with IaaS,
Sees e2e metrics,
Sees both sides,
Can take actions
directly in data plane
5
Challenges of Diagnosis at the “Edge”
•
No direct access to app/OS stack (IaaS model)
•
Single pass on packets (replay is not possible)
•
Support different TCP variants (possibly unknown)
•
Need bi-directional monitoring
•
Low overhead (state and operations on switch)
•
Only one edge
6
Reno,
Cubic,
…
Limited
registers
Stateful Data-plane Programming
7
Parse
Tables
&
Actions
Operations
(+,-,max,..)
Register Array
(e.g., MSS)
Parse &
Hash
One index per bi-directional connection!
Registers
Diagnosing Sender Problem From the Edge
Detect if sender is sending
“
Too few” or “Too late”
•
MSS:
•
Extract TCP options, or max of “segment sizes” seen
•
App Reaction Time:
•
Both directions
•
Arithmetic operation (subtraction)
8
Diagnosing Receiver Problem From the Edge
•
Receive Window:
•
Parse header to extract TCP option
•
Arithmetic operations (shift to scale the window)
•
Delayed ACK:
•
Both directions
•
Comparison operations (Seq. vs Ack)
9
Inferring Network Latency
•
RTT:
•
Need both directions (sequence numbers and ACKs)
•
Comparison operations (ACK ≥ Seq)
•
Arithmetic operations (subtraction)
10
Seq, timestamp
Ack, timestamp
Inferring Network Loss
•
Loss:
•
Detected via re-transmission
•
Comparison operation (sequence numbers)
•
Registers and metadata to compare the dup ACKs
11
Inferring Congestion Window
Congestion Window
:
•
Different TCP congestion controls
•
Unkonwn threshold (e.g., ssthresh to exit slow start)
•
Tuned parameters (e.g., Initial window)
TCP Invariants:
1.
Flight
size
is bounded by CWND
Lower-bound estimate of congestion window
2.
Packet loss changes CWND based on the nature of loss
•
A timeout resets CWND to initial window
•
A fast-retransmit causes a multiplicative decrease in CWND
12
Inferring Flight Size
Flight size
: number of packets in flight
13
Fligh Size : 1
Flight Size : 2
Flight Size : 1
Flight Size : 0
Estimating CWND
14
•
If flight size increases:
•
CWND <- flight size
•
If a loss is observed:
•
Decrease CWND appropriately
•
From different starting points:
a)
Beginning
b)
After 1 sec
c)
After 3 sec
Dapper’s Implementation in P4
15
•
Need symmetric hashing for bi-directional cross packet analysis
Parse
Extract
Hash
Read
Registers,
Metadata
Stages
(conditions)
Write to
Registers
Operations
Dapper’s Limitations
•
Diagnosis granularity:
•
Identifies the component (network, sender, or receiver)
•
Hardware capabilities:
•
Accessing a register at multiple stages
•
Hardware capacity:
•
Switches have a limited number of registers
•
Collision reduces the monitoring accuracy
16
Overhead in Software
17
•
Software: Not constrained for memory, CPU matters
•
Setup:
•
Parallel TCP flows between a server-client pair, with average rate of 1 Mbps.
•
Total CPU consumption (packet capturing, copying, analysis)
Overhead in Hardware
18
•
Hardware: Runs at line-rate, but limited memory
•
keeps 67B per connection
•
Collision in hash table:
•
K connections, hash table size of N
Conclusion
•
Performance diagnosis in the cloud is challenging but important
•
Providers require real time diagnosis
•
Dapper, a data plane diagnosis framework for TCP
•
Compatible with IaaS cloud
•
Leverage functionality in emerging data plane platforms
•
Dapper enables a whole range of proactive resolution techniques
•
Can take actions directly in the data plane
19
Thank you!
20
How to diagnose TCP problems at linerate in dataplane
Researchers from Princeton University and Duke University delve into diagnosing performance issues in TCP data planes within public clouds. They address challenges related to monitoring, identifying poor TCP performance sources, and diagnosing problems at the edge, proposing solutions for efficient diagnosis at the sender level.

Download Presentation

Please find below an Image/Link to download the presentation.
The content on the website is provided AS IS for your information and personal use only. It may not be sold, licensed, or shared on other websites without obtaining consent from the author. Download presentation by click this link. If you encounter any issues during the download, it is possible that the publisher has removed the file from their server.
E N D
Presentation Transcript
Dapper: Data Plane Performance Diagnosis of TCP Mojgan Ghasemi Princeton University Theophilus Benson Duke University Jennifer Rexford Princeton University 1
Public Clouds VM2 VM3 VM2 VM3 VM1 VM1 VM2 VM3 VM1 Public cloud operators need: High utilization (to reduce cost) Good performance (to satisfy tenants) Detecting, diagnosing, and fixing performance problems quickly is crucial! 3
Sources of Poor TCP Performance Segment size, MSS, App reaction time Not Delayed ACK Receive window, delayed ACK backlogged! app app High RTT High Loss Low BW Receive buffer is full Send buffer too small Congestion window, RTT, loss Identifying the component is the most time-consuming and expensive part Our goal: quickly pinpoint the component impairing TCP performance 4
Location of Performance Monitoring No visibility into e2e metrics, Different paths for packet stream Violates trust in IaaS cloud, Complicates billing Compatible with IaaS, Sees e2e metrics, Sees both sides, Can take actions directly in data plane 5
Challenges of Diagnosis at the Edge No direct access to app/OS stack (IaaS model) Single pass on packets (replay is not possible) Support different TCP variants (possibly unknown) Need bi-directional monitoring Low overhead (state and operations on switch) Only one edge Reno, Cubic, app app Limited registers 6
Stateful Data-plane Programming Tables & Actions Operations (+,-,max,..) Registers Parse Register Array (e.g., MSS) Parse & Hash One index per bi-directional connection! 7
Diagnosing Sender Problem From the Edge Detect if sender is sending Too few or Too late MSS: Extract TCP options, or max of segment sizes seen App Reaction Time: Both directions Arithmetic operation (subtraction) app app Seq2 En-queue based on outgoing De-queue based on incoming SND.NXT SND.NXT-1 SND.NXT-2 SND.NXT-3 Time Stamp 4 En-queue based on outgoing Ack1 Time Stamp 3 Time Stamp 2 Time Stamp 1 De-queue based on incoming SND.NXT-3 SND.NXT-2 SND.NXT-1 SND.NXT 8 Time Stamp 1 Time Stamp 2 Time Stamp 3 Time Stamp 4
Diagnosing Receiver Problem From the Edge Receive Window: Parse header to extract TCP option Arithmetic operations (shift to scale the window) Delayed ACK: Both directions Comparison operations (Seq. vs Ack) app app Seq2 Seq1 SND.NXT Seq3 En-queue based on outgoing SND.NXT En-queue based on outgoing De-queue based on incoming De-queue based on incoming En-queue based on outgoing De-queue based on incoming SND.NXT-1 SND.NXT SND.NXT-1 SND.NXT-2 SND.NXT-1 SND.NXT-2 SND.NXT-3 SND.NXT-2 SND.NXT-3 SND.NXT-3 Time Stamp 4 Time Stamp 3 Time Stamp 4 Time Stamp 3 Time Stamp 2 Time Stamp 3 Time Stamp 2 Time Stamp 1 Time Stamp 2 Time Stamp 1 Time Stamp 1 Time Stamp 4 De-queue based on incoming En-queue based on outgoing SND.NXT-3 SND.NXT-2 SND.NXT-1 SND.NXT 9 Ack Time Stamp 1 Time Stamp 2 Time Stamp 3 Time Stamp 4
Inferring Network Latency RTT: Need both directions (sequence numbers and ACKs) Comparison operations (ACK Seq) Arithmetic operations (subtraction) app app Seq, timestamp En-queue based on outgoing De-queue based on incoming SND.NXT SND.NXT-1 SND.NXT-2 SND.NXT-3 Time Stamp 4 Time Stamp 3 Time Stamp 2 Time Stamp 1 De-queue based on incoming En-queue based on outgoing SND.NXT-3 SND.NXT-2 SND.NXT-1 SND.NXT Ack, timestamp Time Stamp 1 Time Stamp 2 Time Stamp 3 Time Stamp 4 10
Inferring Network Loss Loss: Detected via re-transmission Comparison operation (sequence numbers) Registers and metadata to compare the dup ACKs Seq1 En-queue based on outgoing De-queue based on incoming SND.NXT SND.NXT-1 app SND.NXT-2 SND.NXT-3 app Seq1 Time Stamp 4 Time Stamp 3 Time Stamp 2 Time Stamp 1 En-queue based on outgoing De-queue based on incoming SND.NXT SND.NXT-1 SND.NXT-2 SND.NXT-3 Time Stamp 4 Time Stamp 3 Time Stamp 2 Time Stamp 1 11
Inferring Congestion Window Congestion Window: Different TCP congestion controls Unkonwn threshold (e.g., ssthresh to exit slow start) Tuned parameters (e.g., Initial window) TCP Invariants: 1. Flightsizeis bounded by CWND Lower-bound estimate of congestion window 2. Packet loss changes CWND based on the nature of loss A timeout resets CWND to initial window A fast-retransmit causes a multiplicative decrease in CWND 12
Inferring Flight Size Flight size: number of packets in flight app app Seq2 Seq1 En-queue based on outgoing De-queue based on incoming En-queue based on outgoing De-queue based on incoming SND.NXT-3 SND.NXT-3 Fligh Size : 1 Flight Size : 2 Flight Size : 1 Flight Size : 0 SND.NXT SND.NXT-1 SND.NXT-1 SND.NXT-2 SND.NXT-2 SND.NXT Time Stamp 4 Time Stamp 4 En-queue based on outgoing outgoing Time Stamp 3 Time Stamp 3 Time Stamp 2 Time Stamp 2 Time Stamp 1 Time Stamp 1 De-queue based on incoming incoming De-queue based on En-queue based on SND.NXT-3 SND.NXT-3 SND.NXT-2 SND.NXT-2 SND.NXT-1 SND.NXT-1 SND.NXT SND.NXT Ack1 Ack2 Time Stamp 1 Time Stamp 1 Time Stamp 2 Time Stamp 2 Time Stamp 3 Time Stamp 3 Time Stamp 4 Time Stamp 4 13
Estimating CWND If flight size increases: CWND <- flight size If a loss is observed: Decrease CWND appropriately From different starting points: a) Beginning b) After 1 sec c) After 3 sec 14
Dappers Implementation in P4 Operations Need symmetric hashing for bi-directional cross packet analysis Stages (conditions) new update registers tcp.seqNo > seqNo pkts_sent F last_seq_sent T sample_seq samples=0 flighsize > _cwnd reaction_time sample_time segment flight_size sample for RTT T T Parse & Hash Write to Registers sender IP cwnd outgoing update cwnd seqNo F F T pkts_retx ackNo pkts_retx retx T sample_seq dup_ack sample_seq sender IP = srcIP dup_ack=3 sample_time samples sample_time parse headers, hash to get flow key incoming cwnd cwnd cwnd F Update upon Fast Retransmit sample_seq Update upon timeout F tcp.ackNo > ackNo read conditional registers Two sets of headers, In the reverse order, Consistent comparison of direction (srcIP > dstIP) dup_pkts T new ACK Count duplicate ACKs rtt_sample sample_seq Parse Extract Hash T tcp.ack_no>= sample_seq Read Registers, Metadata samples flow_srtt Make new RTT sample and use it 15
Dappers Limitations Diagnosis granularity: Identifies the component (network, sender, or receiver) Hardware capabilities: Accessing a register at multiple stages Hardware capacity: Switches have a limited number of registers Collision reduces the monitoring accuracy 16
Overhead in Software Software: Not constrained for memory, CPU matters Setup: Parallel TCP flows between a server-client pair, with average rate of 1 Mbps. Total CPU consumption (packet capturing, copying, analysis) 17
Overhead in Hardware Hardware: Runs at line-rate, but limited memory keeps 67B per connection Collision in hash table: K connections, hash table size of N 18
Conclusion Performance diagnosis in the cloud is challenging but important Providers require real time diagnosis Dapper, a data plane diagnosis framework for TCP Compatible with IaaS cloud Leverage functionality in emerging data plane platforms Dapper enables a whole range of proactive resolution techniques Can take actions directly in the data plane 19
Thank you! 20