Supervised Learning Algorithms and Model Evaluation
C
h
a
p
t
e
r
8
T
u
n
i
n
g
S
u
p
e
r
v
i
s
e
d
L
e
a
r
n
e
r
s
•
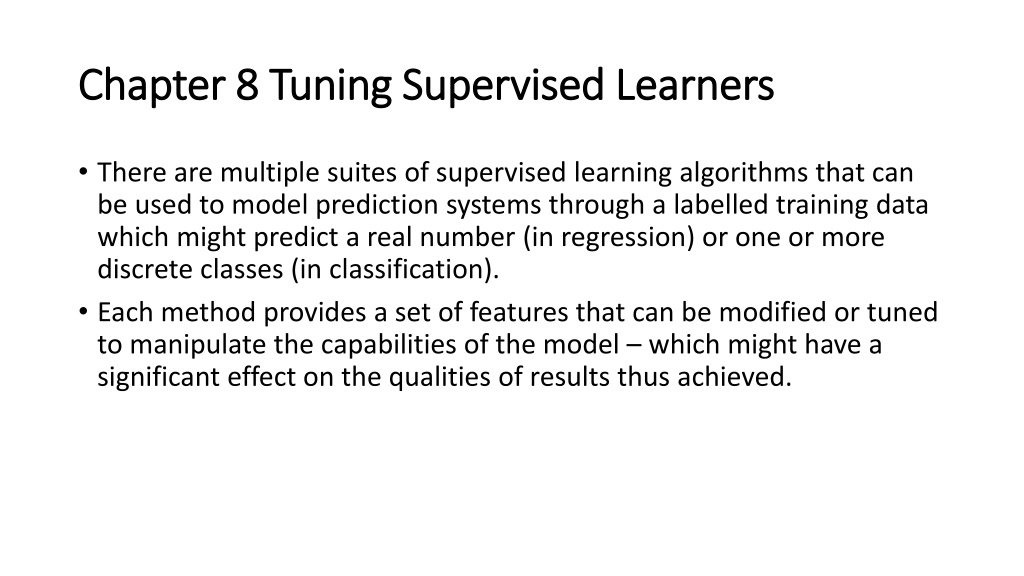
There are multiple suites of supervised learning
algorithms that can
be used to model prediction systems through a labelled training data
which might predict a real number (in regression) or one or more
discrete classes (in
classification).
•
Each method provides a set of features that can be modified or tuned
to
manipulate the capabilities of the model – which might have a
significant effect on the
qualities of results thus achieved.
T
r
a
i
n
i
n
g
a
n
d
T
e
s
t
i
n
g
P
r
o
c
e
s
s
e
s
•
A machine learning experiment is divided into two primary phases.
•
The model is first fit on a training dataset.
•
The training dataset contains training tuples that contain an input
vector and the corresponding output.
•
The predicted quantity is usually called the target.
•
In the second part, the model is used to predict the targets for
another labelled dataset called test dataset.
•
However, this data is not exposed to the learning algorithm during
training – thus, it is unseen by the model.
•
This provides a way to perform unbiased evaluation of the model.
M
e
a
s
u
r
e
s
o
f
P
e
r
f
o
r
m
a
n
c
e
•
Once we create a machine learning model and fit it in a data pipeline
to predict results for a previously unseen sample of data, we need to
ensure that the model is accurate.
•
Measuring the quality of results that a classifier model can generate is
an important topic that requires sufficient understanding of the
model as well as the domain your problem is based on.
Confusion Matrix
•
Confusion matrix is a simple contingency table that is used to visualize
the performance of a classification algorithm which may classify the
elements into two or more classes.
•
In the table, each row represents the items belonging to the actual
classes, and each column represents the items belonging to the
predicted classes.
•
The samples that are correctly labelled as negative are called True
Negatives (TN), and the ones that are incorrectly labelled as negative
are called False Negatives (FN).
•
Similarly, the model predicted eight people as positive, out of which
five are correctly predicted as positive, thus indicating the True
Positives (TP). The three items that are incorrectly labelled as positive
but are actually negative are called False Positives (FP).
•
True Positives and True Negatives amount to the overall accuracy of
your model.
•
False Positives are often called Type 1 Error, and False Negatives are
called Type 2 Error.
•
Though there’s usually a trade-off between the two, which error
should you be more concerned about depends on the problem you’re
trying to solve.
Recall
•
Recall is a measure that indicates the ratio of positive test data items
that are correctly identified out of all the items that are actually
positive.
Precision
•
Precision is the measure that indicates ratio of the number of
correctly predicted positive points to the number of all the points that
were predicted as positive.
•
Both precision and recall should be as high as possible.
•
However, in some cases, we find as we attempt to increase the recall
the precision might relatively decrease.
Accuracy
•
Accuracy is a simple measure that denotes how many items are
correctly classified into both the classes.
F-Measure
•
F-measure or F1-Score is a score obtained by taking the harmonic
mean of precision and recall to give a general picture of the goodness
of the classification model.
•
Harmonic mean, instead of using the arithmetic mean, penalizes the
extreme values more and moves more toward the lower value of the
two.
P
e
r
f
o
r
m
a
n
c
e
M
e
t
r
i
c
s
i
n
P
y
t
h
o
n
•
Scikit-learn provides three APIs for evaluating the model quality,
namely, estimator score method, scoring parameter, and metric
functions.
•
Estimator score method is the model.score() method that can be
called for every object of any classifier, regression, or clustering
classes.
•
For the code in this section, we assume that you have created a
classifier for Iris flower classification in the previous chapter.
import pandas as pd
from sklearn import datasets
iris = datasets.load_iris()
iris_data = pd.DataFrame(iris['data'], columns=iris['feature_names'])
iris_data['target'] = iris['target']
iris_data['target'] = iris_data['target'].apply( lambda x:iris['target_names'][x] )
X = iris_data[['sepal length (cm)', 'sepal width (cm)', 'petal length (cm)','petal wi
dth (cm)']]
y = iris_data['target']
from sklearn.model_selection import train_test_split
X_train, X_test, y_train, y_test = train_test_split (X,y,test_size=0.20,random_sta
te=0)
from sklearn.tree import DecisionTreeClassifier
DT_model = DecisionTreeClassifier(criterion="entropy", max_depth=3)
DT_model.fit(X_train, y_train)
•
Now we will import sklearn.metrics so that we can access all the
metric functions in this module.
import sklearn.metrics
•
Assuming you have trained the model, we will now find predicted
class labels for the test dataset.
y_pred = DT_model.predict(X_test)
print (y_pred)
•
This should print the array containing predicted values of all the test
data samples.
•
Print the confusion metrics using
print(sklearn.metrics.confusion_matrix(y_test, y_pred))
array([[15, 0, 0],
[ 0, 10, 1],
[ 0, 0, 12]], dtype=int64)
•
sklearn.metrics also contains functions for precision, recall, and F-
measure.
•
All these functions take at least two arguments: the actual class labels
and the predicted class labels.
•
If you have more than two classes, you can give the additional
function parameter for average, which may contain one of the
following values:
•
binary: Default, the function only reports the results for the positive class
labels.
•
micro: Calculate metrics globally by counting the total true positives, false
negatives, and false positives.
•
macro: Calculate metrics for each label, and find their unweighted mean. This
does not take label imbalance into account.
•
weighted: Calculate metrics for each label, and find their average weighted by
the number of instances for each label in the test data and counts for the
label imbalance.
•
We can now find the performance metrics discussed in this section at
macro level.
sklearn.metrics.confusion_matrix(y_test, y_pred)
p = sklearn.metrics.precision_score(y_test, y_pred, average='micro')
r = sklearn.metrics.recall_score(y_test, y_pred, average='micro')
f = sklearn.metrics.f1_score(y_test, y_pred, average='micro')
a = sklearn.metrics.accuracy_score(y_test,y_pred)
print ("Here're the metrics for the trained model:")print ("Precision:\t{}\nRecall:\t{}\nF-Score:\t{}\nAccuracy:\t{}".format(p,r,f,a))
Classification Report
•
Classification report gives most of the important and common metrics
required for
classification tasks in one single view.
•
It shows the precision, recall, and f-score for each
class along with the
support, or the number of actual testing samples that belong to
the
class.
print (sklearn.metrics.classification_report(y_test, y_pred))
C
r
o
s
s
V
a
l
i
d
a
t
i
o
n
•
We divide the labelled dataset into two components – namely,
training set and validation
(or testing) set.
•
It is a good idea to come with a rotation of
training and testing parts
to be able to determine how well will the model generalize to
an
independent dataset.
•
Over the k iterations, we will obtain k metrics, which can be averaged
to find a more
generalizable metric that can be used to tune the
hyperparameters.
Why Cross Validation?
•
If we tweak a model based on a static test set, it is possible to
overoptimize and overfit on
the test set which may not generalize to
more unseen data.
•
The knowledge about the test
set can indirectly creep into the model,
and evaluation metrics are not generalized.
•
Thus,
multiple folds of the data provide an opportunity to not tune
the results on one static set.
Cross Validation in Python
•
For cross validation, we will not consider randomly created train-test
splits as in previous
examples but work with the features and the
values.
import pandas as pd
from sklearn import datasets
iris = datasets.load_iris()
X = pd.DataFrame(iris['data'], columns=iris['feature_names'])
y = iris['target']
•
We will now use fivefold cross validation to create multiple splits:
from sklearn.model_selection import KFold
kf = KFold(n_splits=5)
kf.get_n_splits(X)
•
This initiates fivefold cross validation that will produce five splitting
iterations, each
containing approximately 120 elements in training set
and 30 elements in testing set.
•
We can look at the index of the elements that are chosen for training
and testing in each
iteration as follows:
for i, (train_index, test_index) in enumerate(kf.split(X)):
print ("Iteration "+str(i+1))print("Train Indices:", train_index, "\nTest Indices:", test_index,"\n")•
We can use the data points in each iteration to fit the model:
score_history = []
for train, test in kf.split(X, y):
clf = DecisionTreeClassifier()
clf.fit(X.values[train,:], y[train])
y_pred = clf.predict(
X.values[test,:]
)
score_history.append(clf.score(X.values[test,:], y_pred))
R
O
C
C
u
r
v
e
•
Various classification algorithms can be configured to produce a class
label based on a predefined threshold on the probability of the data
item belonging to a class.
•
The classifier’s predictions can strongly differ based on the threshold.
This indirectly affects the precision and recall, sensitivity and
specificity.
•
In the following experiments, we will train a logistic regression model
and find True Positive Rate and False Positive Rate based on
classification output for different threshold of the model.
•
from sklearn.datasets import make_moons
•
X1, Y1 = make_moons(n_samples=1000, shuffle=True, noise=0.1)
•
import matplotlib.pyplot as plt
•
plt.figure(figsize=(8, 8))
•
plt.scatter(X1[:, 0], X1[:, 1], marker='o', c=Y1, s=25, edgecolor='k')
•
plt.show()
•
For generating less complex dataset, you can use
from sklearn.datasets import make_classification
X1, y1 = make_classification(n_classes=2, n_features=2, n_redundant=0,
n_informative=1, n_clusters_per_class=1)
•
We will train a logistic regression model.
from sklearn.linear_model import LogisticRegression
from sklearn.model_selection import train_test_split
X_train,X_test,y_train,y_test =
train_test_split(X1,y1,test_size=0.2,random_state=42)
logreg = LogisticRegression()
logreg.fit(X_train,y_train)
•
Instead of predict() method, we can call predict_proba() method that
produces each point belonging to the second class (class label=1).
logreg.predict_proba(X_test)
•
We will take one of the columns for the probability and manipulate
the threshold and monitor the effect it has on TPR and FPR.
y_pred_proba = logreg.predict_proba(X_test)[:,1]
from sklearn.metrics import roc_curve
[fpr, tpr, thr] = roc_curve(y_test, y_pred_proba)
•
The objects returned from the last statement can be used to analyze
the effect of setting different thresholds.
•
The curve can be traces across multiple values of threshold.
•
Before that, we will introduce one more metric, which takes the false
positive rates and true positive rates and, based on them, computes
the area under the curve thus generated.
from sklearn.metrics import auc
auc (fpr, tpr)
•
Let’s plot the graph.
import matplotlib.pyplot as plt
plt.figure()
plt.plot(fpr, tpr, color='coral', label = 'ROC Curve with Area Under Curve
='+str(auc (fpr, tpr)))
plt.xlabel('False positive Rate (1 - specificity)')plt.ylabel('True Positive Rate ')plt.legend(loc='lower right')
plt.show()
O
v
e
r
f
i
t
t
i
n
g
a
n
d
R
e
g
u
l
a
r
i
z
a
t
i
o
n
•
We can fine-tune the models to fit the training data very well.
•
In this process, we often play with several properties of the
algorithms that may directly manipulate the complexity of the models.
•
Let’s try to play with linear regression and use a more complex model
to fit the training data points from the last chapter more precisely.
•
We will create a new set of features to take simple arithmetic
transformation of the independent variable and fit linear regression
based on them.
•
This method is called polynomial regression.
import numpy as np
import pandas as pd
from sklearn.linear_model import LinearRegression
from sklearn.preprocessing import PolynomialFeatures
data = pd.DataFrame({"marks":[34,51,64,88,95,99], "salary":[3400, 2900, 4250,5000, 5100, 5600]})
X = data[['marks']].values
y = data['salary'].values
poly = PolynomialFeatures(3)
X1 = poly.fit_transform(X)
reg = LinearRegression()
reg.fit(X1, y)
X_seq = np.linspace(X.min(),X.max(),100).reshape(-1,1)
X_seq_1 = poly.fit_transform(X_seq)
y_seq = reg.predict(X_seq_1)
import matplotlib.pyplot as plt
plt.figure()
plt.scatter(X,y)
plt.plot(X_seq, y_seq,color="black")
plt.show()
•
You can see that we can increase the complexity and the predictions
fit the training data more closely, thus reducing the overall error and
improving the accuracy.
•
This looks promising but might be misleading.
X_seq = np.linspace(0,100,100).reshape(-1,1)
X_seq_2 = poly.fit_transform(X_seq)
y_seq = reg.predict(X_seq_2)
plt.figure()
plt.scatter(X,y)
plt.plot(X_seq, y_seq,color="black")
plt.show()
•
Here in Figure 8-6, we tried to increase the complexity of the model
so that it captures the training data better.
•
However, this led to unexpected errors for the data that wasn’t
present in the real data.
•
This is called
overfitting
.
•
If we instead reduce the number of parameters, say, 1, we are
drastically reducing the complexity of the model, and we will be able
to capture less details from the training data.
•
In our example, the model with only one parameter will return the
average salary based on the training data, and thus, a horizontal line
parallel to the x axis will represent the predictions as shown in Figure
8-7.
•
That is, the model will predict the same salary regardless of the marks
a student attains.
•
This is called
underfitting
.
B
i
a
s
a
n
d
V
a
r
i
a
n
c
e
•
Bias and variance are the properties of a model that arise due to
either oversimplicity or overcomplexity of our model.
•
Bias, in general, represents how far a model’s predictions are
compared to the actual values.
•
A model with high bias means that the model is overly simple, and
the assumptions it has learned are too basic.
•
For that reason, the model isn’t able to properly capture the
necessary patterns in the data. Thus, the model has high error while
training, as well as while predicting.
•
Variance represents how sensitive the model is to fluctuations in the
data.
•
Say, we have a data point that represents a student who obtained 35
marks and a salary of $6000 and another data point for a student who
obtained 34 marks and a salary of $2000, and the system tries to
learn the difference from both; this can cause huge difference in how
the predictions are generated.
•
When the variance is high, the model will capture all the features of
the dataset, including the noise and randomness. Thus, it becomes
overly tuned.
•
However, when it encounters unseen data, it might yield
unexpectedly poor results.
•
Such a model yields a low training error; however, the error is quite
high while testing.
•
We need to find a balance between bias and variance in order to
come up with a model that is sensitive to patterns in our data while
also being able to generalize to new unseen data. The trends in error
with respect to model complexity are shown in Figure 8-8.
R
e
g
u
l
a
r
i
z
a
t
i
o
n
•
A way is to manipulate the cost function that penalizes
overcomplexity in the model in order to find the right parameters
instead of explicitly limiting the numbers of parameters to learn.
•
Eventually, we reach a middle ground where the model is complex
enough to
capture the essence of the structure of the training data
while penalizing over complexity
so that we avoid learning from
extreme outliers and noise.
L1 and L2 Regularization
•
Regularization is a technique that discourages learning a more
complex or flexible
model, so as to avoid the risk of overfitting by
manipulating the cost function to avoid
learning weights that are too
high.
import numpy as np
import pandas as pd
from sklearn.linear_model import LinearRegression, Lasso, Ridge
from sklearn.preprocessing import PolynomialFeatures
import matplotlib.pyplot as plt
data = pd.DataFrame({"marks":[34,51,64,88,95,99], "salary":[3400, 2900,4250,5000, 5100, 5600]})
X = data[['marks']].values
y = data['salary'].values
fig, axs = plt.subplots(1,3, figsize=(15,5))
methods = ['Polynomial Regression', 'Lasso Regression alpha=1', 'RidgeRegressi
on alpha=1']
for i in [0,1,2]:
poly = PolynomialFeatures(3)
X1 = poly.fit_transform(X)
if i==0:
reg = LinearRegression()
reg.fit(X1, y)
if i==1:
reg = Lasso(alpha=1)
reg.fit(X1, y)
if i==2:
reg = Ridge(alpha=1)
reg.fit(X1, y)
X_seq = np.linspace(0,X.max(),100).reshape(-1,1)
X_seq_1 = poly.fit_transform(X_seq)
y_seq = reg.predict(X_seq_1)
axs[i].scatter(X,y)
axs[i].plot(X_seq, y_seq,color="black")
axs[i].set_title(methods[i])
plt.show()
•
In this code example, we reattempt the problem of predicting
students’ salary based
on the marks they obtained.
•
Here, we have first converted the only independent variable
(marks)
into polynomial features and then trained three models based on that.
•
The
first one is regression without regularization, the second one is
Lasso Regression, and
the third one is Ridge Regression. The effect of
the two techniques is evident from the
regression line they produce
as shown in Figure 8-9.
H
y
p
e
r
p
a
r
a
m
e
t
e
r
T
u
n
i
n
g
•
While approaching a machine learning problem, you have to engineer
and select the
right features, pick the algorithm, and tune the
selected algorithm (or algorithms) for the
hyperparameters they are
affected by.
•
The terms hyperparameters and parameters can’t be used
interchangeably.
•
Parameters are the weights a model learns during learning phase.
•
Hyperparameters are the externally controlled elements that affect
how and what
the model learns.
•
You might often face the choices like the following:
–– “K” in K-nearest neighbors
–– Regularization strength in Ridge Regression and Lasso Regression
–– Maximum depth of a decision tree
–– Learning rate for gradient descent
Effect of Hyperparameters
•
We will do a simple experiment to see how closely we fit a synthetic
dataset using the
first two columns based on the hyperparameters we can
tune for logistic regression.
•
Let’s create a dataset using Scikit-learn’s make classification functionality.
from sklearn.datasets import make_classification
X, y = make_classification(n_samples=400, n_features=2, n_informative=2,
n_redundant=0)
•
We will need to create separate training dataset and test dataset for
analyzing the
accuracy.
from sklearn.model_selection import train_test_split
X_train, X_test, y_train, y_test = train_test_split(X,y, test_size=0.3)
•
Now we will use logistic regression with polynomial features. We will
iteratively try
different polynomial degree and see the difference it makes
in the accuracy.
accuracy_history = []
from sklearn.linear_model import LogisticRegression
import sklearn.metrics
for i in range(1,15):
poly = PolynomialFeatures(i)
X1 = poly.fit_transform(X_train)
reg = LogisticRegression(max_iter=100)
reg.fit(X1, y_train)
X1_test = poly.transform(X_test)
y_pred = reg.predict(X1_test)
accuracy_history.append(sklearn.metrics.accuracy_score(y_test, y_pred))
•
Let’s plot the accuracy:
import matplotlib.pyplot as plt
plt.plot(accuracy_history)
•
We can see in Figure 8-10 that the accuracy increases from degree 5
to degree 7 and then decreases again. Based on this analysis with
only one hyperparameter, which is the degree of the polynomial, find
the hyperparameter value that yields the best accuracy.
•
If we have multiple hyperparameters, we have to evaluate the model
for multiple possible values for each hyperparameter. Let’s look at the
scenario for creating decision tree classifier. These are some of the
hyperparameters you can tune:
•
criterion: Either Gini based or entropy based.
•
max_depth: Maximum depth of a tree.
•
min_samples_split: Minimum number of samples that are required to split a
node. It can be either an integer representing the number or a float that
represents a fraction of total samples.
•
min_samples_leaf: Minimum number of samples that should be present in
both right leaf and left leaf.
•
We discussed the working of decision tree in the previous chapter.
You can see that such decisions can impact the quality of end results.
Let’s say w
•
criterion: Gini, entropy (two possible values)
•
max_depth: None, 5, 10, 20 (four possible values)
•
min_samples_split: 4, 8, 16 (three possible values)
•
min_samples_split: 4, 8, 16 (three possible values)e have the following
possibilities:
•
By considering all the options, we will build up to 2x4x3x3 = 72
decision trees, out of which, we will select the one that gives the best
metrics.
•
It is possible to make the selections with the use of multiple loops.
•
Scikit-learn provides ready-to-use implementations to exhaust all the
possibilities (grid search) and test random possibilities (random
search).
Grid Search
•
Grid search, or parameter sweep, is the process of searching through
a specified subset of hyperparameter spaces exhaustively.
Random Search
•
Rather than exhaustively searching for all the combinations in the
parameter space, random search selects random possibilities and
selects the best model accordingly.
S
u
m
m
a
r
y
•
This chapter has provided us with the essentials that will be used in
any machine learning experiment to evaluate and tune the models. In
the next chapter, we will study more supervised learning methods.
Multiple suites of supervised learning algorithms are available for modeling prediction systems using labeled training data for regression or classification tasks. Tuning features can significantly impact model results. The training-testing process involves fitting the model on a training dataset and evaluating its performance on a separate test dataset. Measures like confusion matrices help assess the accuracy of classification models.

Download Presentation

Please find below an Image/Link to download the presentation.
The content on the website is provided AS IS for your information and personal use only. It may not be sold, licensed, or shared on other websites without obtaining consent from the author.If you encounter any issues during the download, it is possible that the publisher has removed the file from their server.
You are allowed to download the files provided on this website for personal or commercial use, subject to the condition that they are used lawfully. All files are the property of their respective owners.
The content on the website is provided AS IS for your information and personal use only. It may not be sold, licensed, or shared on other websites without obtaining consent from the author.
E N D
Presentation Transcript
Chapter 8 Tuning Supervised Chapter 8 Tuning Supervised Learners Learners There are multiple suites of supervised learning algorithms that can be used to model prediction systems through a labelled training data which might predict a real number (in regression) or one or more discrete classes (in classification). Each method provides a set of features that can be modified or tuned to manipulate the capabilities of the model which might have a significant effect on the qualities of results thus achieved.
Training and Testing Processes Training and Testing Processes A machine learning experiment is divided into two primary phases. The model is first fit on a training dataset. The training dataset contains training tuples that contain an input vector and the corresponding output. The predicted quantity is usually called the target.
In the second part, the model is used to predict the targets for another labelled dataset called test dataset. However, this data is not exposed to the learning algorithm during training thus, it is unseen by the model. This provides a way to perform unbiased evaluation of the model.
Measures of Performance Measures of Performance Once we create a machine learning model and fit it in a data pipeline to predict results for a previously unseen sample of data, we need to ensure that the model is accurate. Measuring the quality of results that a classifier model can generate is an important topic that requires sufficient understanding of the model as well as the domain your problem is based on.
Confusion Matrix Confusion matrix is a simple contingency table that is used to visualize the performance of a classification algorithm which may classify the elements into two or more classes. In the table, each row represents the items belonging to the actual classes, and each column represents the items belonging to the predicted classes.
The samples that are correctly labelled as negative are called True Negatives (TN), and the ones that are incorrectly labelled as negative are called False Negatives (FN). Similarly, the model predicted eight people as positive, out of which five are correctly predicted as positive, thus indicating the True Positives (TP). The three items that are incorrectly labelled as positive but are actually negative are called False Positives (FP).
True Positives and True Negatives amount to the overall accuracy of your model. False Positives are often called Type 1 Error, and False Negatives are called Type 2 Error. Though there s usually a trade-off between the two, which error should you be more concerned about depends on the problem you re trying to solve.
Recall Recall is a measure that indicates the ratio of positive test data items that are correctly identified out of all the items that are actually positive.
Precision Precision is the measure that indicates ratio of the number of correctly predicted positive points to the number of all the points that were predicted as positive.
Both precision and recall should be as high as possible. However, in some cases, we find as we attempt to increase the recall the precision might relatively decrease.
Accuracy Accuracy is a simple measure that denotes how many items are correctly classified into both the classes.
F-Measure F-measure or F1-Score is a score obtained by taking the harmonic mean of precision and recall to give a general picture of the goodness of the classification model. Harmonic mean, instead of using the arithmetic mean, penalizes the extreme values more and moves more toward the lower value of the two.
Performance Metrics in Python Performance Metrics in Python Scikit-learn provides three APIs for evaluating the model quality, namely, estimator score method, scoring parameter, and metric functions. Estimator score method is the model.score() method that can be called for every object of any classifier, regression, or clustering classes.
For the code in this section, we assume that you have created a classifier for Iris flower classification in the previous chapter. import pandas as pd from sklearn import datasets iris = datasets.load_iris() iris_data = pd.DataFrame(iris['data'], columns=iris['feature_names']) iris_data['target'] = iris['target'] iris_data['target'] = iris_data['target'].apply( lambda x:iris['target_names'][x] ) X = iris_data[['sepal length (cm)', 'sepal width (cm)', 'petal length (cm)','petal wi dth (cm)']] y = iris_data['target']
from sklearn.model_selection import train_test_split X_train, X_test, y_train, y_test = train_test_split (X,y,test_size=0.20,random_sta te=0) from sklearn.tree import DecisionTreeClassifier DT_model = DecisionTreeClassifier(criterion="entropy", max_depth=3) DT_model.fit(X_train, y_train)
Now we will import sklearn.metrics so that we can access all the metric functions in this module. import sklearn.metrics Assuming you have trained the model, we will now find predicted class labels for the test dataset. y_pred = DT_model.predict(X_test) print (y_pred) This should print the array containing predicted values of all the test data samples.
Print the confusion metrics using print(sklearn.metrics.confusion_matrix(y_test, y_pred)) array([[15, 0, 0], [ 0, 10, 1], [ 0, 0, 12]], dtype=int64)
sklearn.metrics also contains functions for precision, recall, and F- measure. All these functions take at least two arguments: the actual class labels and the predicted class labels.
If you have more than two classes, you can give the additional function parameter for average, which may contain one of the following values: binary: Default, the function only reports the results for the positive class labels. micro: Calculate metrics globally by counting the total true positives, false negatives, and false positives. macro: Calculate metrics for each label, and find their unweighted mean. This does not take label imbalance into account. weighted: Calculate metrics for each label, and find their average weighted by the number of instances for each label in the test data and counts for the label imbalance.
We can now find the performance metrics discussed in this section at macro level. sklearn.metrics.confusion_matrix(y_test, y_pred) p = sklearn.metrics.precision_score(y_test, y_pred, average='micro') r = sklearn.metrics.recall_score(y_test, y_pred, average='micro') f = sklearn.metrics.f1_score(y_test, y_pred, average='micro') a = sklearn.metrics.accuracy_score(y_test,y_pred) print ("Here're the metrics for the trained model:") print ("Precision:\t{}\nRecall:\t{}\nF-Score:\t{}\nAccuracy:\t{}". format(p,r,f,a))
Classification Report Classification report gives most of the important and common metrics required for classification tasks in one single view. It shows the precision, recall, and f-score for each class along with the support, or the number of actual testing samples that belong to the class. print (sklearn.metrics.classification_report(y_test, y_pred))
Cross Validation Cross Validation We divide the labelled dataset into two components namely, training set and validation (or testing) set. It is a good idea to come with a rotation of training and testing parts to be able to determine how well will the model generalize to an independent dataset.
Over the k iterations, we will obtain k metrics, which can be averaged to find a more generalizable metric that can be used to tune the hyperparameters.
Why Cross Validation? If we tweak a model based on a static test set, it is possible to overoptimize and overfit on the test set which may not generalize to more unseen data. The knowledge about the test set can indirectly creep into the model, and evaluation metrics are not generalized. Thus, multiple folds of the data provide an opportunity to not tune the results on one static set.
Cross Validation in Python For cross validation, we will not consider randomly created train-test splits as in previous examples but work with the features and the values. import pandas as pd from sklearn import datasets iris = datasets.load_iris() X = pd.DataFrame(iris['data'], columns=iris['feature_names']) y = iris['target']
We will now use fivefold cross validation to create multiple splits: from sklearn.model_selection import KFold kf = KFold(n_splits=5) kf.get_n_splits(X)
This initiates fivefold cross validation that will produce five splitting iterations, each containing approximately 120 elements in training set and 30 elements in testing set. We can look at the index of the elements that are chosen for training and testing in each iteration as follows: for i, (train_index, test_index) in enumerate(kf.split(X)): print ("Iteration "+str(i+1)) print("Train Indices:", train_index, "\nTest Indices:", test_index,"\n")
We can use the data points in each iteration to fit the model: score_history = [] for train, test in kf.split(X, y): clf = DecisionTreeClassifier() clf.fit(X.values[train,:], y[train]) y_pred = clf.predict(X.values[test,:]) score_history.append(clf.score(X.values[test,:], y_pred))
ROC Curve ROC Curve Various classification algorithms can be configured to produce a class label based on a predefined threshold on the probability of the data item belonging to a class. The classifier s predictions can strongly differ based on the threshold. This indirectly affects the precision and recall, sensitivity and specificity. In the following experiments, we will train a logistic regression model and find True Positive Rate and False Positive Rate based on classification output for different threshold of the model.
from sklearn.datasets import make_moons X1, Y1 = make_moons(n_samples=1000, shuffle=True, noise=0.1) import matplotlib.pyplot as plt plt.figure(figsize=(8, 8)) plt.scatter(X1[:, 0], X1[:, 1], marker='o', c=Y1, s=25, edgecolor='k') plt.show()
For generating less complex dataset, you can use from sklearn.datasets import make_classification X1, y1 = make_classification(n_classes=2, n_features=2, n_redundant=0, n_informative=1, n_clusters_per_class=1)
We will train a logistic regression model. from sklearn.linear_model import LogisticRegression from sklearn.model_selection import train_test_split X_train,X_test,y_train,y_test = train_test_split(X1,y1,test_size=0.2,random_state=42) logreg = LogisticRegression() logreg.fit(X_train,y_train)
Instead of predict() method, we can call predict_proba() method that produces each point belonging to the second class (class label=1). logreg.predict_proba(X_test) We will take one of the columns for the probability and manipulate the threshold and monitor the effect it has on TPR and FPR. y_pred_proba = logreg.predict_proba(X_test)[:,1] from sklearn.metrics import roc_curve [fpr, tpr, thr] = roc_curve(y_test, y_pred_proba)
The objects returned from the last statement can be used to analyze the effect of setting different thresholds. The curve can be traces across multiple values of threshold. Before that, we will introduce one more metric, which takes the false positive rates and true positive rates and, based on them, computes the area under the curve thus generated. from sklearn.metrics import auc auc (fpr, tpr)
Lets plot the graph. import matplotlib.pyplot as plt plt.figure() plt.plot(fpr, tpr, color='coral', label = 'ROC Curve with Area Under Curve ='+str(auc (fpr, tpr))) plt.xlabel('False positive Rate (1 - specificity)') plt.ylabel('True Positive Rate ') plt.legend(loc='lower right') plt.show()
Overfitting and Regularization Overfitting and Regularization We can fine-tune the models to fit the training data very well. In this process, we often play with several properties of the algorithms that may directly manipulate the complexity of the models.
Lets try to play with linear regression and use a more complex model to fit the training data points from the last chapter more precisely. We will create a new set of features to take simple arithmetic transformation of the independent variable and fit linear regression based on them. This method is called polynomial regression.
import numpy as np import pandas as pd from sklearn.linear_model import LinearRegression from sklearn.preprocessing import PolynomialFeatures data = pd.DataFrame({"marks":[34,51,64,88,95,99], "salary":[3400, 2900, 4250, 5000, 5100, 5600]}) X = data[['marks']].values y = data['salary'].values poly = PolynomialFeatures(3) X1 = poly.fit_transform(X)
reg = LinearRegression() reg.fit(X1, y) X_seq = np.linspace(X.min(),X.max(),100).reshape(-1,1) X_seq_1 = poly.fit_transform(X_seq) y_seq = reg.predict(X_seq_1) import matplotlib.pyplot as plt plt.figure() plt.scatter(X,y) plt.plot(X_seq, y_seq,color="black") plt.show()
You can see that we can increase the complexity and the predictions fit the training data more closely, thus reducing the overall error and improving the accuracy. This looks promising but might be misleading.
X_seq = np.linspace(0,100,100).reshape(-1,1) X_seq_2 = poly.fit_transform(X_seq) y_seq = reg.predict(X_seq_2) plt.figure() plt.scatter(X,y) plt.plot(X_seq, y_seq,color="black") plt.show()
Here in Figure 8-6, we tried to increase the complexity of the model so that it captures the training data better. However, this led to unexpected errors for the data that wasn t present in the real data. This is called overfitting.
If we instead reduce the number of parameters, say, 1, we are drastically reducing the complexity of the model, and we will be able to capture less details from the training data. In our example, the model with only one parameter will return the average salary based on the training data, and thus, a horizontal line parallel to the x axis will represent the predictions as shown in Figure 8-7. That is, the model will predict the same salary regardless of the marks a student attains. This is called underfitting.
Bias and Variance Bias and Variance Bias and variance are the properties of a model that arise due to either oversimplicity or overcomplexity of our model. Bias, in general, represents how far a model s predictions are compared to the actual values. A model with high bias means that the model is overly simple, and the assumptions it has learned are too basic. For that reason, the model isn t able to properly capture the necessary patterns in the data. Thus, the model has high error while training, as well as while predicting.
Variance represents how sensitive the model is to fluctuations in the data. Say, we have a data point that represents a student who obtained 35 marks and a salary of $6000 and another data point for a student who obtained 34 marks and a salary of $2000, and the system tries to learn the difference from both; this can cause huge difference in how the predictions are generated.
When the variance is high, the model will capture all the features of the dataset, including the noise and randomness. Thus, it becomes overly tuned. However, when it encounters unseen data, it might yield unexpectedly poor results. Such a model yields a low training error; however, the error is quite high while testing.


 method, we can call predict_proba()")


")

.reshape(-1,1)")