Studying Depredation in Small Fishery Operations
The assessment of depredation in a small fishery, particularly in the Falkland Islands, is explored through various studies and monitoring efforts. The research includes evaluating the impact on fish populations, interactions with whales, and the existence of invisible depredation. Observers were employed to track seabird mortalities and toothfish depredation, leading to the compilation of detailed reports and databases for further analysis.

Download Presentation

Please find below an Image/Link to download the presentation.
The content on the website is provided AS IS for your information and personal use only. It may not be sold, licensed, or shared on other websites without obtaining consent from the author.If you encounter any issues during the download, it is possible that the publisher has removed the file from their server.
You are allowed to download the files provided on this website for personal or commercial use, subject to the condition that they are used lawfully. All files are the property of their respective owners.
The content on the website is provided AS IS for your information and personal use only. It may not be sold, licensed, or shared on other websites without obtaining consent from the author.
E N D
Presentation Transcript
Assessing depredation in a small fishery Andreas Winter Joost Pompert Falkland Islands Government
Single quota Single vessel 46 48 Latitude (S) 50 52 54 56 62 60 58 56 54 52 Longitude (W)
Single quota Single vessel 46 48 Limits opportunities for comparing depredation among longline sets. Latitude (S) 50 52 54 56 62 60 58 56 54 52 Longitude (W)
Whale interaction data: Starting in 2002, longline observers were employed by the Fisheries Department specifically to monitor seabird mortalities.
Whale interaction data: Starting in 2002, longline observers were employed by the FIFD specifically to monitor seabird mortalities. Initially 75% of observer time on seabird interaction monitoring, 25% on biological catch sampling. Observer time gradually reduced as seabird mortality declined in the fishery.
Whale monitoring: Presence / interactions recorded during seabird observation periods
Whale interaction data: Summary table produced and included in the observer report for each trip.
Whale interaction data: Summary table produced and included in the observer report for each trip. Data are screened and uploaded onto the Fisheries Department server.
Estimate depredation by comparison No interaction longline sets: No fish on the line reported damaged or destroyed. Whale interaction longline sets: At least one fish of any species on the line reported damaged or destroyed ( heads , lips , gills ).
And Damage not reported as: Shark Crustacean Hagfish
1948 observed longline sets, 2004 to 2015 296 Whale interaction sets 1652 No interaction sets
1948 observed longline sets, 2004 to 2015 296 Whale interaction sets 1652 No interaction sets Compare by: Proximity Predictive model
Proximity: within 2 days , 6 km 296 Whale interaction sets 105 Whale interaction sets have at least one No interaction set within range.
Proximity: within 2 days , 6 km 296 Whale interaction sets 105 Whale interaction sets have at least one No interaction set within range. Comparing CPUE (kg or N toothfish / hooks): Not statistically significant by paired t-test.
Predictive model: GLM Toothfish catch ~ Haul Duration N Hooks Soak Time Gear method Year Vessel Month Depth Latitude Longitude
Predictive model: GLM Toothfish catch ~ Haul Duration N Hooks Soak Time Gear method Year Vessel Month Depth Latitude Longitude Spanish or Umbrella system
Predictive model: Toothfish catch ~ Haul Duration N Hooks Soak Time Gear method GLM using only No interaction sets GLM using all longline sets GLM Year Vessel Month Depth Latitude Longitude
Predictive model: Toothfish catch ~ Haul Duration N Hooks Soak Time Gear method GLM using only No interaction sets GLM using all longline sets Project model prediction onto all sets GLM Year Vessel Month Depth Latitude Longitude
Toothfish catch N (Poisson distribution): Toothfish catch ~ Haul Duration N Hooks Soak Time Gear method Year Vessel Month Depth Latitude Longitude
Toothfish catch N (Poisson distribution): Toothfish catch ~ Haul Duration N Hooks Soak Time Gear method GLM using No interaction sets: 30.5% R GLM using all longline sets: Year Vessel Month Depth Latitude Longitude 33.0% R
Toothfish catch kg (Gaussian distribution): Toothfish catch ~ Haul Duration N Hooks Soak Time Gear method Year Vessel Month Depth Latitude Longitude
Toothfish catch kg (Gaussian distribution): Toothfish catch ~ Haul Duration N Hooks Soak Time Gear method GLM using No interaction sets: 31.0% R GLM using all longline sets: Year Vessel Month Depth Latitude Longitude 32.7% R
Toothfish catch Numbers: For longline sets that actually had No interaction : predicted N [GLM-all sets] predicted N [GLM-no interact.] No statistically significant difference.
Toothfish catch Numbers: For longline sets that actually had Whale interaction : predicted N [GLM-all sets] > predicted N [GLM-no interact.] Significantly higher average N (p < 0.001).
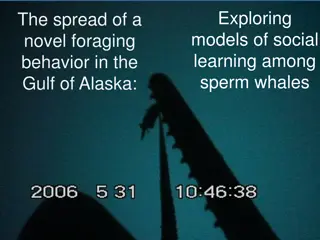
Longline sets attended by whales have more toothfish.
Longline sets attended by whales have more toothfish. In Falkland Islands waters, most whales are sperm whales. Sperm whales feed naturally on tooth- fish. Tixier et al. CCAMLR 2010
Toothfish catch Weight: For longline sets that actually had Whale interaction : predicted kg [GLM-all sets] predicted kg [GLM-no interact.] No statistically significant difference.
Toothfish catch Weight: For longline sets that actually had No interaction : predicted kg [GLM-all sets] < predicted kg [GLM-no interact.] Significantly lower average kg (p < 0.001).
Toothfish catch weight is significantly reduced on longline sets attended by whales; despite the contrasting bias of higher numbers of toothfish in the presence of whales.
Toothfish catch weight is significantly reduced on longline sets attended by whales; despite the contrasting bias of higher numbers of toothfish in the presence of whales. Both killer whales and sperm whales selectively retrieve larger-sized fish from the lines. Guinet et al. ICES 2014
Evaluate differences between All sets and No interaction model predictions: Subtract one from the other. Plot differences vs. co-variates. GLM by catch weight, No-interact. sets
Predicted kg [GLM no interact.] [GLM all sets] 600 400 Difference of toothfish catch (kg) 200 0 -200 -400 750 1000 1250 1500 1750 2000 Depth (m)
Predicted kg [GLM no interact.] [GLM all sets] 600 400 Difference of toothfish catch (kg) 200 0 -200 Depredation occurs less in shallower water. -400 750 1000 1250 1500 1750 2000 Depth (m)
Predicted kg [GLM no interact.] [GLM all sets] 600 400 Difference of toothfish catch (kg) 200 0 -200 Depredation occurs more to the west. -400 60 58 56 54 52 50 Longitude (W)
Predicted kg [GLM no interact.] [GLM all sets] 600 400 Difference of toothfish catch (kg) 200 0 -200 Depredation increases with soak time. (Small effect > 2 days). -400 0 1 2 3 4 5 Soak time (days)
Predicted kg [GLM no interact.] [GLM all sets] 600 Whale depredation not different by month. 400 Difference of toothfish catch (kg) 200 0 -200 -400 1 2 3 4 5 6 7 8 9 10 11 12 Month
In a small fishery with limited comparability, model differencing can provide a means to estimate depredation. More accurate approach to infer Interaction vs Non-interaction sets? Quantify differences w.r.t. co-variates, and w.r.t. offset bias of higher toothfish catch numbers co-occurring with whale presence.


:")
:")
:")
:")