Structural Design Using Finite Elements - Introduction to Safety Margins

In the field of structural design using finite elements, understanding safety margins is crucial. Factors of safety, response vs. capacity, sufficiency factors, and excess capacity are explained to ensure structural integrity and performance optimization.

Download Presentation

Please find below an Image/Link to download the presentation.
The content on the website is provided AS IS for your information and personal use only. It may not be sold, licensed, or shared on other websites without obtaining consent from the author.If you encounter any issues during the download, it is possible that the publisher has removed the file from their server.
You are allowed to download the files provided on this website for personal or commercial use, subject to the condition that they are used lawfully. All files are the property of their respective owners.
The content on the website is provided AS IS for your information and personal use only. It may not be sold, licensed, or shared on other websites without obtaining consent from the author.
E N D
Presentation Transcript
CHAP 8 STRUCTURAL DESIGN USING FINITE ELEMENTS FINITE ELEMENT ANALYSIS AND DESIGN Nam-Ho Kim 1
INTRODUCTION FEA: determining the response of a given structure for a given set of loads and boundary conditions Geometry, material properties, BCs and loads are well defined Engineering design: a process of synthesis in which parts are put together to build a structure that will perform a given set of functions satisfactorily Analysis is systematic and can be taught easily; design is an iterative process Creative design: creating a new structure or machine that does not exist Adaptive design: modifying an existing design (evolutionary process) 2
INTRODUCTION STRUCTURAL DESIGN Structural design: a procedure to improve or enhance the performance of a structure by changing its parameters Performance: a measurable quantity (constraint and goal) the weight, stiffness or compliance; the fatigue life; noise and vibration levels; safety Constraint: As long as the performance satisfies the criterion, its level is not important Ex: the maximum stress should be less than the allowable stress Goal: the performance that the engineer wants to improve as much as possible Design variables: system parameters that can be changed during the design process Plate thickness, cross-sectional area, shape, etc 3
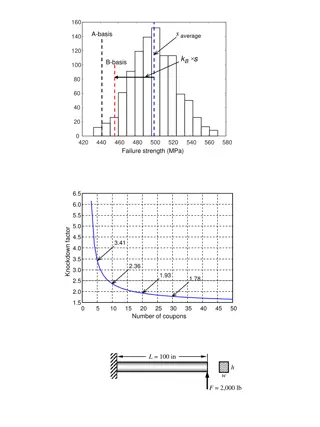
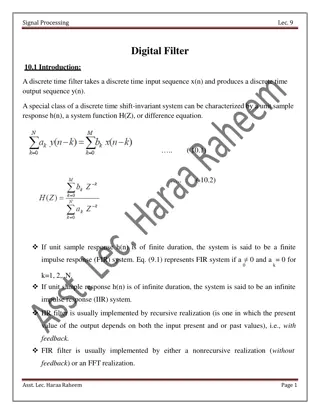
SAFETY MARGIN Factor of Safety (stress performance) Structures should satisfy a constraint: si(x): the calculated stress at a point x in the i-th component sallowable: allowable stress from material strength (failure strength) ( ) x i s s allowable Failure stress Factor of safety s F = s allowable S F Factor of safety: effect of material variability, experimental errors, etc For general type of performance, use response and capacity Response Ri: calculated value of performance Capacity Ci: allowed value of performance C S i R ( ) x i F N L = When multiple loads are applied simultaneously R R F ( ) i i j j 1 = 4
SAFETY MARGIN cont. Safety Margin: the excess capacity compared with the response i i i Z C R = - 0 The member can afford additional Zi stress before it fails Sufficiency Factor Si: ratio of the allowable capacity to the response i i F i S R C S 1 = Normalized in terms of the capacity 5
LOAD FACTOR Instead of dividing the capacity by SF, increase applied loads Load factorl: the factor by which the applied loads must be multiplied just enough to cause the structure to fail Let a set of loads be F = {F1, F2, , FN}T. For a given failure strength Ci, the load factor is defined by R ( ) C F = l i i For proportional loading with linear system C i = l R ( ) F i Load factor is the ratio between capacity and response The structure should be designed in order to satisfy a given level of load factor 6
EXAMPLE Design the height h of cantilevered beam with SF = 1.5 E = 2.9 104 ksi, w = 2.25 in. 1) Allowable tip deflection Dallowable = 2.5 in. (No need SF) FE equation after applying BCs 12 6 6 4 0 L L L q - v L F - EI 2 = 2 3 3 2 4 Ewh FL v allowable D = = 2 3 FE solution 3 2 4 Ewh FL 6 Ewh FL 3 4 FL v , = = q h 3.66 in = = 3 2 2 3 3 EwD allowable L = 100 in h w F = 2,000 lb 7
EXAMPLE cont. 2) Failure strength = 40 ksi (Need SF) Supporting moment at the wall EI C Lv L 2 2 36 4 L 6 Lv 2 L FL = + - + = - q q 1 1 1 2 2 Maximum stress at the wall h M I 6 wh FL 2 = = s max 2 Height calculation with the factor of safety 6 wh FL 6 FLS w s s F F h 4.47in = = = S 2 F F 8
FULLY-STRESSED DESIGN For complex structure with different failure criteria needs an iterative process to find the best design Intuitive design Fully-Stressed Design: Very useful with stress and minimum gage constraints For the best design, each member of the structure that is not at its minimum gage is fully stressed under at least one of the design load conditions From the observation that all members will be in the allowable stress level unless they reach the minimum gage It is based on an assumption that the effect of adding or removing material from a member is to change the stresses in that member Works well with statically determinate structure (member force does not change when the cross-section increases) 9
FSD cont. Assume the loads carried by members remained constant Stress in each member is calculated Member is resized to bring the stress to the allowable value Truss example (member force F = s A) s new A A = old s allowable If member forces are constant (statically determinant system), one iteration to come up FSD Repeated calculations are required when member forces vary If Anew is less than the minimum gage, choose min. gage 10
FSD cont. Beam element: Use section modulus Maximum bending stress M M I S h 2 s = = Section modulus Update section modulus s new S S = old s allowable If M remains constant, one iteration yields FSD The section modulus in beam corresponds to cross-sectional area in truss 11
FSD EXAMPLE CANTILEVERED BEAM Initial w = 2.25, h = 3.5 in. Determine new height using FSD Section modulus and max. stress at the initial design 2 2 2 h I wh 2.25 3.5 6 3 S 4.594 in = = = = old 6 M S 43.537 ksi = = s max old New section modulus using stress ratio resizing 43.537 26.667 s max 3 new S S 4.594 7.5 in = = = old s allowable 2 wh 6 new S w Only one iteration for FSD new S h 4.47 in = = = 6 L = 100 in h w F = 2,000 lb 12
DESIGN PARAMETERS Selecting design variables easy for beam and truss, but more complicated for plane or 3D solids Material property design variable Varying material properties to find the best material Not common, but useful for designing composite materials Sizing design variable Geometric parameters as design (parametric design variable) Appears as a parameter in FEM Thickness of plate/shell, cross-sectional geometry of truss/beam, etc t b b r b r t h h h t w w 13
DESIGN PARAMETERS cont. Shape design variable Related to the structure s geometry, which does not appear explicitly as a parameter Beam cross-section is a geometry, but it appears as a moment of inertia Cx, Cy, and r determine the size and location of the hole Shape design variables change FE mesh Design variables must be limited so that the hole remains inside of the plate r Cx Cx r Cy Cy (a) Initial design (b) Perturbed design 14
DESIGN PARAMETERS cont. Shape design variable cont. Shape design variable describe the movement of boundary Mesh inside of structure must move accordingly Iso-parametric mapping method Works well with mapped mesh, maintaining topological mesh Convenient on tracking the same elements and nodes Possible mesh distortion for large shape-changing design r r (a) Initial mesh (b) Perturbed mesh 15
PARAMETER STUDY SENSITIVITY ANALYSIS Parameter study Effect of a design variable on performance (gradual change of DV) Cantilevered beam example: smax (ksi) 37.5 29.6 24.0 30.0 23.7 19.2 25.0 19.8 16.0 w (in) 2.0 2.0 2.0 2.5 2.5 2.5 3.0 3.0 3.0 h (in) 4.0 4.5 5.0 4.0 4.5 5.0 4.0 4.5 5.0 Allowable stress Acceptable region 16
SENSITIVITY ANALYSIS Parameter study becomes too expensive with many DVs Unable to capture rapid change in performance locally Design sensitivity analysis computes the rate of performance change with respect to design variables Sensitivity analysis calculates gradient of performance for optimization Explicit dependence Analytical relationship exists between performance and DVs Weight of circular cross-section beam 2 W r ( ) r L = p dW dr 2 rL = p Sensitivity w.r.t. r: 17
SENSITIVITY ANALYSIS cont. Implicit dependence Performance depends on DVs through state variable (displacement) Sensitivity of stress: d d d dr d dr q q s s = Difficult to calculate, time consuming Easy to calculate from given expression of stress How to calculate displacement sensitivity? Differentiate finite element equation: [ ( )]{ } b K { ( )} b F Q = [ ]{ } { } db d d db d db Q F K { } K Q = - [dK/db] and {dF/db} can be evaluated using either their analytical expression or numerical differentiation 18
SENSITIVITY ANALYSIS cont. Sensitivity equation must be solved for each design variable Sensitivity equation uses the same stiffness matrix with the original finite element analysis Consider RHS as a pseudo-force vector Similar to finite element analysis with multiple load cases Thus, solving sensitivity equation is very inexpensive using factorized stiffness matrix General form of performance Sensitivity( ) H H ( ), b b q = Implicit dependent term dH ( ( ), ) b b db H b H q d db q q = + const b const q = = Explicit dependent term 19
FINITE DIFFERENCE SENSITIVITY Easiest way to compute sensitivity information of the performance Calculate performance at two different designs Forward difference method + D D db b dH H b ( b ) H b ( ) - Central difference method dH db H b ( b ) 2 H b b ( b ) + D - D - D Consider FEA as a black-box Sensitivity computation cost becomes high for many design variables n+1 analyses for forward FDM 2N+1 analyses for central FDM 20
FINITE DIFFERENCE SENSITIVITY cont. Accuracy of finite difference sensitivity Accurate results can be expected when Db approaches zero For nonlinear performances, a large perturbation yields completely inaccurate results Numerical noise becomes dominant for a too-small perturbation size H (dH/db)4 (dH/db)3 (dH/db)2 (dH/db)1 b0b1 b2 b3 b4 b 21
EXAMPLE CANTILEVERED BEAM At optimum design (w=2.25 in, h=4.47 in), calculate sensitivity of tip displacement w.r.t. h Exact sensitivity: 3 2 4 exact dh Ewh 3 dv 12 FL 12 2,000 10 100 4.118 = - = - = - 7 3 2.9 2.25 4.47 Differentiate [K] 12 6 12 6 L 6 L L 12 6 12 6 L 6 L L 0 0 L 12 L - - - 2 2 L 4 L 2 12 - d db F Lh F K { } Q = = 4 4 h 6 L L 6 L L 4 12 0 - - - 2 2 2 4 6 - Pseudo load vector 12 L { } db 12 d d db F F K { } Q - = 4 h 12 0 - 22
EXAMPLE CANTILEVERED BEAM cont. Sensitivity equation: - 6 L dv d / / db db 0 0 12 6 12 6 L L 12 6 12 6 L 6 L L 12 L = = - - 1 2 2 L 4 L 2 12 q dv d EI L F 1 = 4 h 3 / / db db 6 L L 6 L L 12 0 - - - 2 2 2 2 4 - q 2 Same way of applying BC - - 6 4 L L dv d / / db db 12 6 L L 12 0 - EI F 2 = 2 4 h 3 q 2 Sensitivity of nodal DOFs 12 dv db Ewh 3 2 FL d db 18 Ewh FL q 2 2 , = - = - 4 3 Same with the exact sensitivity 23
STRUCTURAL OPTIMIZATION What Is Design Optimization? To find the best design parameters that meet the design goal and satisfies constraints. Design Parameters: Anything the Designer Can Change Thickness of a plate Cross-sectional geometry of a beam or truss Geometric dimensions Design Goal: Objective Function Design criterion that will be minimized (or maximized) Mass, Stress, Displacement, Natural Frequency, ETC Constraint: Conditions that the system must satisfy Stress, Displacement, ETC Note: Design parameters must affect the design goal and constraints. 24
OPTIMIZATION FLOW CHART Physical engineering problem Structural modeling Design parameterization Performance definition (cost, constraints) Structural analysis (FEM, BEM, CFD ) model update Structural Design sensitivity analysis Optimized? No Yes Stop 25
THREE-STEP PROBLEM FORMULATION w 1. Design Parameterization Clear identification Independence of designs t1 t2 h 2. Objective Function Must be a function of design parameters Minimization ( Maximization) 3. Constraint Functions Inequality constraints Equality constraints Equality constraints must be less than the number of design parameters 26
STANDARD FORM Standard form of design optimization minimize subject to ( ) ( ) i g b f b 0, i 1, , , N b L M = L h ( ) 0, j 1, = = j L l U l b b b , l 1, , K L = l T { } b b b : Design parameters :Objective function :Inequality constraints :Equality constraints :Lower and upper bounds b = b L 1 2 K ( ) ( ), ( ), , b b f g h , , g h ( ) ( ) b b b b L L 1 N 1 L M U Feasible set: the set of designs that satisfy constraints { } S g ( ) b 0, i 1 , N h , ( ) b 0, j 1 , M b L L = = = = i j 27
BEER CAN EXAMPLE Design the beer can size so that the minimum amount of sheet metal can be used (minimize manufacturing cost) D H Constraints It is required to hold at least 400 ml of fluid. The diameter of the can should be no more than 8 cm. In addition, it should not be less than 3.5 cm (shipping & handling). The height of the can should be no more than 18 cm and no less than 8 cm. 28
BEER CAN EXAMPLE cont. Standard Form p 2 2 minimize f ( ) b DH D cm = + p 2 p 2 3 subject to 400 D H 0 cm - 4 D H 3.5 8.0 8 18 cm cm Feasible Domain S 29
GLOBAL OPTIMIZATION Global Optimum A point b* is called a globalminimum for f(b) if * f ( ) f ( ) b S b b " There is no mathematical method to find the global minimum Weierstrass theorem: Existence of global minimum If f(b) is continuous and the set S is closedandbounded, then there is a global minimum Local Optimum A point b* is called a localminimum for f(b) if Feasible set f(b) * f ( ) f ( ) b b for all b S in a small neighborhood of b* Global optimum: b3 Local optima: b1, b3, b5 b b4 b6 b5 b2 30 b3 b1
GRAPHICAL OPTIMIZATION Graphical methods can be used to solve the optimization problem when it has only one or two design variables Graphical methods are expensive but help to visualize the design space and to understand the nature of design problem 1. Draw the design space (lower- & upper-bounds of DVs) 2. Plot constraints on the graph (feasible set) 3. Plot contour lines of objective function 4. Find the optimum point (the objective function has the lowest value within the feasible set) 31
NUMERICAL METHODS In FEA, we don t know the explicit relationship, f(b), between design parameters and objective (or constraint) function. But, we can calculate f(b) for a given b by solving the finite element equation. Then, how can we find the optimum design? Use Numerical Method Numerical Method From the current design, find the next design that can reduce the objective function and satisfy constraints. Repeat the search until there is no way to improve the objective function further. 33
NUMERICAL METHOD cont. Basic Algorithm 1. Start with b(K) and K = 0. Initial design must be given 2. Evaluate function values and their gradients. Using finite element analysis 3. Using information from Step 2, determine b(K). Design change 4. Check for termination. Stop if the problem is converged. 5. Update design ( K 1) ( ) K ( ) K + b b b = + D 6. Increase K = K + 1 and go to Step 2. Design iteration (cycle) 34
NUMERICAL METHOD cont. Change in Design ( ) K ( ) K b d D = a K K: Step size d(K): Search direction vector Design change means the determination of search direction and step size. 35
OPTIMIZATION USING EXCEL SOLVER 1 Four-bar truss optimization Minimize f( ) b L 3 b 3 b = + 1 2 1 3 18 b 6 3 b L subject to g 3 0 = + - 1 2 1 - - 2 3 F 2 g g 5.73 7.17 b b 0 0 = = 4 4 2 1 3L 3 2 2F 36