Statistics Homework Agenda and Classroom Review

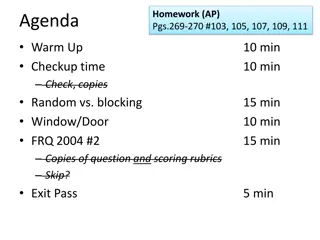
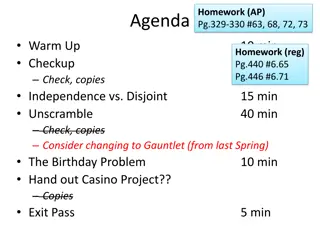
Agenda
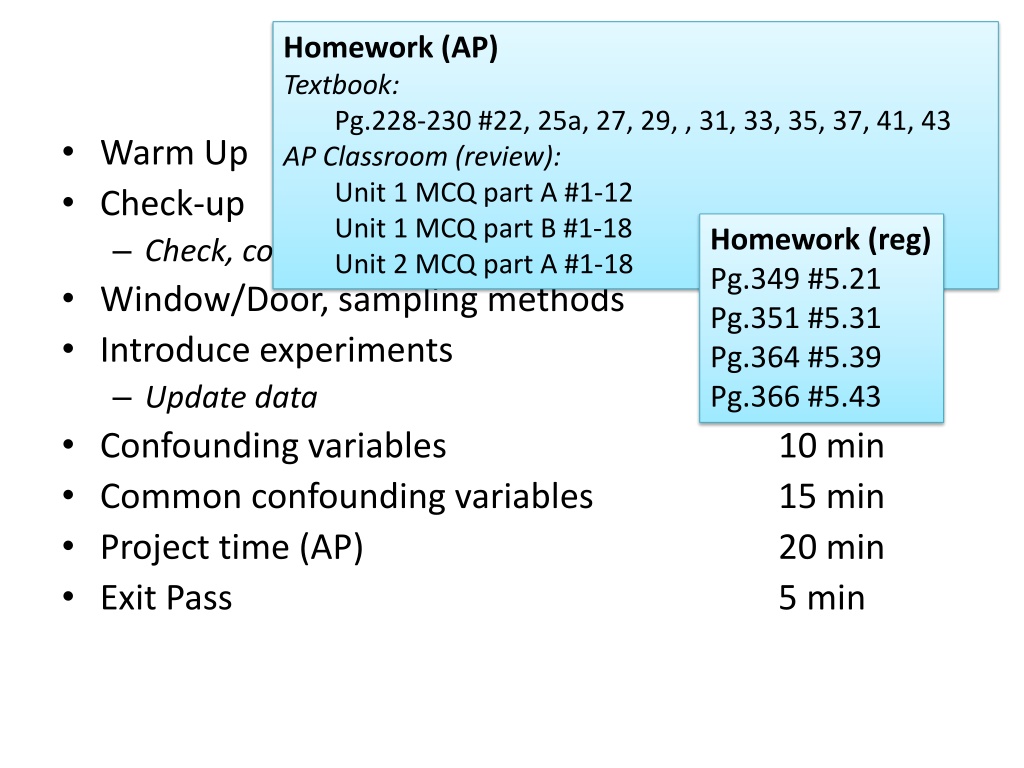
•
Warm Up
10 min
•
Check-up
10 min
–
Check, copies
•
Window/Door, sampling methods
10 min
•
Introduce experiments
10 min
–
Update data
•
Confounding variables
10 min
•
Common confounding variables
15 min
•
Project time (AP)
20 min
•
Exit Pass
5 min

Homework (AP)
Textbook:
Pg.228-230 #22, 25a, 27, 29, , 31, 33, 35, 37, 41, 43
AP Classroom (review):
Unit 1 MCQ part A #1-12
Unit 1 MCQ part B #1-18
Unit 2 MCQ part A #1-18

Homework (reg)
Pg.349 #5.21
Pg.351 #5.31
Pg.364 #5.39
Pg.366 #5.43
Warm Up
A physical education instructor wants to compare the
percentage of body fat for joggers, cyclists, and swimmers.
1.
When would this be an observational study and when
would it be a designed experiment?
2.
What is the response variable?
You’ve heard that RCHS students want a crosswalk painted
from the school across Linden (to Target). You want to
select a representative sample of the RCHS student body to
survey about this issue.
3.
Briefly describe how to get a stratified random sample.
4.
Briefly describe how to get a cluster sample.
tinyurl.com/602seating
Homework (AP)
Textbook:
Pg.228-230 #22, 25a, 27, 29, , 31, 33, 35, 37, 41, 43
AP Classroom (review):
Unit 1 MCQ part A #1-12
Unit 1 MCQ part B #1-18
Unit 2 MCQ part A #1-18
Free-response questions
•
Groups of 3.
•
Complete on back of paper, or on separate
paper titled “FRQ practice”.
•
Each student chooses one question. Compare
answers. Critique.
•
Trade answers with a group-member. Grade it.
FRQ 2004 #2
a.
You’re only asking the first 100 people who
enter the dining hall, so many of them probably
know each other, and they’re probably early
eaters. Not representative. Use systematic
sampling instead, ask every 10
th
person.
b.
Response bias. By stating a negative
consequence after asking the question, the
surveyors are decreasing the chances that
participants will state that they want the food
improved. Eliminate the 2
nd
half of the sentence,
after the comma.
FRQ 2008 #2
a.
You only get people with strong opinions.
b.
This doesn’t solve the problem at all….you’ll
still have non-response bias, just twice as
many strongly opinionated people.
c.
Face-to-face interviews. Include the forms in
mandatory paperwork at the beginning of
the school year. Provide incentives for
participating.
FRQ 2005 #5
a.
Non-response bias, people hang up their
phones so you only get strong opinions.
OR undercoverage bias, you’re only sampling
people who have telephones, so it’s not a
representative sample.
c.
Stratified sampling by state. Randomly select
an equal number of households from each
state,
Window/Door
Let’s say I want you to help me predict enrollment
in my AP Statistics classes over the next 2 years. I
want you to ask a sample of RCHS students about
whether they plan to sign up for AP Statistics.
•
List one method (good or bad) of obtaining a
representative sample.
•
Describe how you would use that method in
the context of this study.
•
State whether this method would be good or
bad in this situation.
Checkup time
Experiments
(Finally)
Why did you hold up your fingers?
•
Flavor preference
Milk chocolate
OR
Dark chocolate
Why did you hold up your fingers?
•
Flavor preference
•
Not sure what you like??
•
Choose what you’re used to, not what you prefer
•
Lactose-intolerant
•
Prior food
•
rBST?
•
Parents’ food eaten
•
CHEATING
•
Order
•
Hate fingers
•
Order of tasting
•
Hold breath
•
Prior traumatic experience w/ chocolate
•
Way you taste
•
Sheep
•
Size of piece
•
Desire to be consistent (cognitive dissonance)
•
Texture
•
Self-denial
•
Brand
•
Flavor preference
•
Texture
•
Genetics
•
Pre-existing flavor
•
Peer influence
•
Sense deprivation
•
Ate something before
•
Fear of being different
•
Response bias, LYING
•
Hungry
•
Thirsty
•
Pre-existing expectations
•
% cacao
•
Better flavor
•
Texture (burn)
•
Hunger
•
Water
•
Chocolate chip?
•
Sugar
•
Smell
•
Talking
•
Laughing
•
Pressure, time
•
Cheating
•
Knowledge
•
Not anonymous
•
Lights
•
Air temperature
•
What you were thinking
•
Crumbs
•
Quality of water washing
•
Boredom
•
Dinner
•
Snacks
Milk chocolate
OR
Dark chocolate
Confounding
(“lurking”, extraneous”)
•
A confounding variable is an undesired 3
rd
variable
that “influences” your treatment and response.
•
Examples
:
–
“Ice cream causes shark attacks.”
–
“Larger pant sizes cause salary increases”.
•
Experiments
control
possible confounding variables
–
To “control” means….
1.
Keep consistent (ideal)
2.
OR randomize (realistic)
–
Example:
Chocolate experiment. What did I control for?
Notes
1 of 2
Common confounding variables
•
Placebo effect
–
Many subjects respond to
any
treatment, even fake ones
•
Example:
H. K. Beecher evaluated 15 clinical trials concerned with
different diseases. 35% of 1,082 patients were satisfactorily
relieved
just by placebo
(Beecher, 1955)
–
SOLUTIONS:
•
Control group
a group of patients who receive no treatment.
Compare results with treatment group(s)
•
Blinding
patients do not know which group they are in
•
Experimenter bias
–
Many experiments
want
their hypotheses to be confirmed
–
SOLUTION:
•
Double-blinding
patients
and
experimenters do not know
groups when giving treatments
Notes
2 of 2
Example
•
“Gastric freezing” is a safe and easy treatment for
ulcers in the upper intestine, and has been widely
used for many years.
•
Patients swallow a deflated balloon with tubes
attached, then a refrigerated liquid is pumped
through the balloon to relieve ulcers.
•
The
Journal of the American Medical Association
reported that gastric freezing reduced acid
production and ulcer pain in 34% of patients.
•
When a control group received a placebo (at
body temperature), 38% had reduced acid
production and ulcer pain.
Exit Pass
An April 7, 2000 article from the
Davis Enterprise
, headlined “Survey:
City people are more prone to illnesses” states that “City dwellers get
sick more often than their rural counterparts. And people who live in
areas of high unemployment are more likely to feel unhealthy. These
trends were drawn from a five-year study . . . by the Centers for Disease
Control and Prevention.”
1.
Observational study or a designed experiment?
2.
Briefly describe two other variables that might also cause city
dwellers to get sick more often that rural dwellers.
Homework (AP)
Textbook:
Pg.228-230 #22, 25a, 27,
29, , 31, 33, 35, 37, 41, 43
AP Classroom (review):
Unit 1 MCQ part A #1-12
Unit 1 MCQ part B #1-18
Unit 2 MCQ part A #1-18
https://goo.gl/EL5oTH
In this content, you will find information on a statistics homework agenda covering textbook exercises, AP classroom review topics, warm-up questions related to physical education, and free-response questions for practice. Concepts include observational studies, sampling methods, confounding variables, and survey techniques. Detailed explanations and examples are provided to enhance understanding of statistical principles.

Download Presentation

Please find below an Image/Link to download the presentation.
The content on the website is provided AS IS for your information and personal use only. It may not be sold, licensed, or shared on other websites without obtaining consent from the author.If you encounter any issues during the download, it is possible that the publisher has removed the file from their server.
You are allowed to download the files provided on this website for personal or commercial use, subject to the condition that they are used lawfully. All files are the property of their respective owners.
The content on the website is provided AS IS for your information and personal use only. It may not be sold, licensed, or shared on other websites without obtaining consent from the author.
E N D
Presentation Transcript
Homework (AP) Textbook: Agenda Pg.228-230 #22, 25a, 27, 29, , 31, 33, 35, 37, 41, 43 AP Classroom (review): Unit 1 MCQ part A #1-12 Unit 1 MCQ part B #1-18 Unit 2 MCQ part A #1-18 Warm Up Check-up Check, copies Window/Door, sampling methods Introduce experiments Update data Confounding variables Common confounding variables Project time (AP) Exit Pass 10 min 10 min Homework (reg) Pg.349 #5.21 Pg.351 #5.31 Pg.364 #5.39 Pg.366 #5.43 10 min 10 min 10 min 15 min 20 min 5 min
Warm Up A physical education instructor wants to compare the percentage of body fat for joggers, cyclists, and swimmers. 1. When would this be an observational study and when would it be a designed experiment? 2. What is the response variable? tinyurl.com/602seating You ve heard that RCHS students want a crosswalk painted from the school across Linden (to Target). You want to select a representative sample of the RCHS student body to survey about this issue. 3. Briefly describe how to get a stratified random sample. 4. Briefly describe how to get a cluster sample.
Homework (AP) Textbook: Pg.228-230 #22, 25a, 27, 29, , 31, 33, 35, 37, 41, 43 AP Classroom (review): Unit 1 MCQ part A #1-12 Unit 1 MCQ part B #1-18 Unit 2 MCQ part A #1-18
Free-response questions Groups of 3. Complete on back of paper, or on separate paper titled FRQ practice . Each student chooses one question. Compare answers. Critique. Trade answers with a group-member. Grade it.
FRQ 2004 #2 a. You re only asking the first 100 people who enter the dining hall, so many of them probably know each other, and they re probably early eaters. Not representative. Use systematic sampling instead, ask every 10th person. b. Response bias. By stating a negative consequence after asking the question, the surveyors are decreasing the chances that participants will state that they want the food improved. Eliminate the 2nd half of the sentence, after the comma.
FRQ 2008 #2 a. You only get people with strong opinions. b. This doesn t solve the problem at all .you ll still have non-response bias, just twice as many strongly opinionated people. c. Face-to-face interviews. Include the forms in mandatory paperwork at the beginning of the school year. Provide incentives for participating.
FRQ 2005 #5 a. Non-response bias, people hang up their phones so you only get strong opinions. OR undercoverage bias, you re only sampling people who have telephones, so it s not a representative sample. c. Stratified sampling by state. Randomly select an equal number of households from each state,
Window/Door Let s say I want you to help me predict enrollment in my AP Statistics classes over the next 2 years. I want you to ask a sample of RCHS students about whether they plan to sign up for AP Statistics. List one method (good or bad) of obtaining a representative sample. Describe how you would use that method in the context of this study. State whether this method would be good or bad in this situation.
Experiments (Finally)
Dark Chocolate Actual preference Stated preference Milk Dark Total Milk 28 4 32 Dark 2 9 11 Total 30 13 43 Dark Chocolate Actual preference Stated preference Milk Dark Total Milk Dark Total 20 2 3 5
Why did you hold up your fingers? Flavor preference Milk chocolate OR Dark chocolate
Why did you hold up your fingers? Flavor preference Not sure what you like?? Choose what you re used to, not what you prefer Lactose-intolerant Prior food rBST? Parents food eaten CHEATING Order Hate fingers Order of tasting Hold breath Prior traumatic experience w/ chocolate Way you taste Sheep Size of piece Desire to be consistent (cognitive dissonance) Texture Self-denial Brand Flavor preference Texture Genetics Pre-existing flavor Peer influence Sense deprivation Ate something before Fear of being different Response bias, LYING Hungry Thirsty Pre-existing expectations % cacao Better flavor Texture (burn) Hunger Water Chocolate chip? Sugar Smell Talking Laughing Pressure, time Cheating Knowledge Not anonymous Lights Air temperature What you were thinking Crumbs Quality of water washing Boredom Dinner Snacks Milk chocolate OR Dark chocolate
Notes Confounding( lurking , extraneous ) 1 of 2 A confounding variable is an undesired 3rd variable that influences your treatment and response. Examples: Ice cream causes shark attacks. Larger pant sizes cause salary increases . Experiments control possible confounding variables To control means . 1. Keep consistent (ideal) 2. OR randomize (realistic) Example: Chocolate experiment. What did I control for?
Notes Common confounding variables Placebo effect Many subjects respond to any treatment, even fake ones Example: H. K. Beecher evaluated 15 clinical trials concerned with different diseases. 35% of 1,082 patients were satisfactorily relieved just by placebo (Beecher, 1955) SOLUTIONS: Control group a group of patients who receive no treatment. Compare results with treatment group(s) Blinding patients do not know which group they are in Experimenter bias Many experiments want their hypotheses to be confirmed SOLUTION: Double-blinding patients and experimenters do not know groups when giving treatments 2 of 2
Example Gastric freezing is a safe and easy treatment for ulcers in the upper intestine, and has been widely used for many years. Patients swallow a deflated balloon with tubes attached, then a refrigerated liquid is pumped through the balloon to relieve ulcers. The Journal of the American Medical Association reported that gastric freezing reduced acid production and ulcer pain in 34% of patients. When a control group received a placebo (at body temperature), 38% had reduced acid production and ulcer pain.
Homework (AP) Textbook: Pg.228-230 #22, 25a, 27, 29, , 31, 33, 35, 37, 41, 43 AP Classroom (review): Unit 1 MCQ part A #1-12 Unit 1 MCQ part B #1-18 Unit 2 MCQ part A #1-18 Exit Pass An April 7, 2000 article from the Davis Enterprise, headlined Survey: City people are more prone to illnesses states that City dwellers get sick more often than their rural counterparts. And people who live in areas of high unemployment are more likely to feel unhealthy. These trends were drawn from a five-year study . . . by the Centers for Disease Control and Prevention. 1. Observational study or a designed experiment? 2. Briefly describe two other variables that might also cause city dwellers to get sick more often that rural dwellers.
")

")


")