Statistics and Epidemiology for the AKT Exam
Some Statistics for the AKT
Section 2 of the AKT content guide
•
Covers research, statistics and epidemiology.
•
10% of the exam
•
‘This element is designed to examine the
candidate’s ability to use evidence and data to
underpin clinical decision making, and the
possession of critical appraisal skills sufficient to
recognise good evidence and adopt guidelines as
appropriate’
What we are going to cover:
•
Some statistical terminology (not all of it )
•
Calculations for evidence based practice
•
Graphical representations
•
General advice for the AKT
The contingency table
The null hypothesis
•
No relationship between two measured
phenomena.
•
Rejecting the null hypothesis leads to the
conclusion that there is a relationship
between the phenomena.
Type 1 vs Type 2 error
Sensitivity
•
Measures the proportion of positive patients
that are correctly identified as such.
Sensitivity
Specificity
•
Measures the proportion of negative patients
that are correctly identified as such.
Specificity
Positive predictive and negative
predictive values
•
Proportions of positive and negative values
that are true positives and true negatives.
PPV and NPV
Example
•
400 plants are selected from a field. 75 of them
have round leaves, the rest have pointy leaves.
•
Scientists have developed a test to determine if a
plant has round leaves or pointed leaves. 60
plants with round leaves were round positive. 20
plants with pointy leaves were round positive as
well.
•
Calculate the sensitivity, specificity, PPV and NPV
of the test.
Step 1
Step 1
Step 2
Step 2
Evidence Based Practice
Absolute Risk Reduction
•
The change in the risk of an outcome of a
given treatment/activity in relation to a
comparison treatment/activity.
Absolute Risk Reduction
•
ARR = EER-CER
Number Needed to Treat
•
The average number of patients who need to
be treated to prevent one additional bad
outcome
Number Needed to Treat
Number Needed to Treat
•
For example a drug will treat a disease. P
A
is
the probability the drug will treat the disease.
P
B
is the probability the group still have the
disease.
Number Needed to Treat
Relative Risk
•
The probability of an event occurring in an
exposed group to the probability occurring in
a non exposed group.
Relative Risk
Odds Ratios
•
A measure of association between an
exposure and an outcome
Odds Ratios
Example
•
200 rabbits are randomly allocated to two
groups. They have all been exposed to a virus.
100 of the rabbits are given the treatment . 95
rabbits are cured. Of the 100 rabbits given a
placebo, 10 are cured.
•
Calculate the ARR, NNT, Relative risk and odds
ratios.
Step 1
Step 1
Step 2
•
How would you calculate ARR?
•
ARR = EER-CER = 0.85=85%
Step 2
Step 2
Step 2
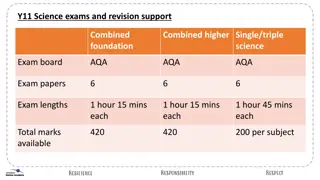
Graphical Representations
Normal distribution
Skewed distribution
Scatter diagrams
Box plots
Forest plots
Funnel plots
http://www.bmj.com/content/343/bmj.d4002
Cates diagrams
Kaplan Meier curves
Conclusion
•
We covered some terminology and
calculations involved in the AKT
•
We also covered some diagrams and the
interpretation of these diagrams
What else should I do?
•
Go over section 2 of the AKT content guide.
•
Do lots of practice questions.
•
Learn the statistical terminology (59+ terms)
•
Understand the principles of screening
What about the administration
section?
•
Oxford Handbook of GP first few chapters tells
you most of what you need to know about
section 3.
Learn (this is not an exhaustive list):
-
DVLA fitness to drive guidelines,
-
CAA fitness to fly guidelines,
-
Childhood imms schedule,
-
School exclusion guidelines,
-
Child development milestones,
-
UKMEC guidelines,
-
Emergency management,
-
Consultation models,
-
Any relevant CKS/NICE guidelines of common
conditions.
Questions?
•
Ideas?
•
Concerns??
•
Expectations???
The content covers essential topics in statistics and epidemiology for the AKT exam. It includes discussions on statistical terminology, calculations for evidence-based practice, graphical representations, and general advice for the exam. Key concepts such as the contingency table, null hypothesis, type 1 vs. type 2 errors, sensitivity, and specificity are explained with visual aids to enhance understanding and application in clinical decision-making.

Download Presentation

Please find below an Image/Link to download the presentation.
The content on the website is provided AS IS for your information and personal use only. It may not be sold, licensed, or shared on other websites without obtaining consent from the author.If you encounter any issues during the download, it is possible that the publisher has removed the file from their server.
You are allowed to download the files provided on this website for personal or commercial use, subject to the condition that they are used lawfully. All files are the property of their respective owners.
The content on the website is provided AS IS for your information and personal use only. It may not be sold, licensed, or shared on other websites without obtaining consent from the author.
E N D
Presentation Transcript
Section 2 of the AKT content guide Covers research, statistics and epidemiology. 10% of the exam This element is designed to examine the candidate s ability to use evidence and data to underpin clinical decision making, and the possession of critical appraisal skills sufficient to recognise good evidence and adopt guidelines as appropriate
What we are going to cover: Some statistical terminology (not all of it ) Calculations for evidence based practice Graphical representations General advice for the AKT
The contingency table True condition Positive Negative Positive True positive (TP) False positive (FP) Type 1 error Test condition Negative False negative (FN) Type 2 error True negative (TN)
The null hypothesis No relationship between two measured phenomena. Rejecting the null hypothesis leads to the conclusion that there is a relationship between the phenomena.
Sensitivity Measures the proportion of positive patients that are correctly identified as such. True condition Positive Negative Positive True positive (TP) False positive (FP) Type 1 error Test condition Negative False negative (FN) Type 2 error True negative (TN)
Sensitivity How would you calculate it? ?? Sensitivity = ??+?? True condition Positive Negative Positive True positive (TP) False positive (FP) Type 1 error Test condition Negative False negative (FN) Type 2 error True negative (TN)
Specificity Measures the proportion of negative patients that are correctly identified as such. True condition Positive Negative Positive True positive (TP) False positive (FP) Type 1 error Test condition Negative False negative (FN) Type 2 error True negative (TN)
Specificity How would you calculate it? ?? Specificity = ??+?? True condition Positive Negative Positive True positive (TP) False positive (FP) Type 1 error Test condition Negative False negative (FN) Type 2 error True negative (TN)
Positive predictive and negative predictive values Proportions of positive and negative values that are true positives and true negatives. True condition Positive Negative Positive True positive (TP) False positive (FP) Type 1 error Test condition Negative False negative (FN) Type 2 error True negative (TN)
PPV and NPV How would you calculate these? ?? PPV = ??+?? ?? ??+?? NPV = True condition Positive Negative Positive True positive (TP) False positive (FP) Type 1 error Test condition Negative False negative (FN) Type 2 error True negative (TN)
Example 400 plants are selected from a field. 75 of them have round leaves, the rest have pointy leaves. Scientists have developed a test to determine if a plant has round leaves or pointed leaves. 60 plants with round leaves were round positive. 20 plants with pointy leaves were round positive as well. Calculate the sensitivity, specificity, PPV and NPV of the test.
Step 1 Leaves Round Pointy Round positive Test Round negative
Step 1 Leaves Round Pointy Round positive 60 15 Test Round negative 20 305
Step 2 Plug in the numbers ?? 60+20=60 305 305+15=305 60 Sensitivity = 80= 75% ??+??= ?? ??+??= Specificity = 320= 95.3% Leaves Round Pointy Round positive 60 15 Test Round negative 20 305
Step 2 ?? 60+15= 60 305 305+20= 305 60 PPV = ??+??= ?? ??+??= 75= 80% NPV = 325= 93.8% Leaves Round Pointy Round positive 60 15 Test Round negative 20 305
Evidence Based Practice Experimental group (E) Control Group (C) Events (E) EE CE Non events (N) EN CN Total subjects (S) ES CS Event rate (ER) EER CER
Absolute Risk Reduction The change in the risk of an outcome of a given treatment/activity in relation to a comparison treatment/activity. Experimental group (E) Control Group (C) Events (E) EE CE Non events (N) EN CN Total subjects (S) ES CS Event rate (ER) EER CER
Absolute Risk Reduction ARR = EER-CER Experimental group (E) Control Group (C) Events (E) EE CE Non events (N) EN CN Total subjects (S) ES CS EER=?? CER=?? Event rate (ER) ?? ??
Number Needed to Treat The average number of patients who need to be treated to prevent one additional bad outcome Experimental group (E) Control Group (C) Events (E) EE CE Non events (N) EN CN Total subjects (S) ES CS Event rate (ER) EER CER
Number Needed to Treat 1 NNT = ??? ??? Experimental group (E) Control Group (C) Events (E) EE CE Non events (N) EN CN Total subjects (S) ES CS Event rate (ER) EER CER
Number Needed to Treat For example a drug will treat a disease. PA is the probability the drug will treat the disease. PBis the probability the group still have the disease.
Number Needed to Treat Description PA PB NNT Interpretation Everybody is cured with the pill; nobody without Perfect drug 0.0 1.0 1.0 Ten take the pill; 8 cured by the pill, 1 cured by itself, 1 still sick. Ten take the pill; 4 cured by the pill, 3 cured by itself, 3 still sick. Ten take the pill; 6 cured but 5 of those would be cured anyway. Ten take the pill, one is cured by the pill, one cured by itself, 8 still have the disease. Ten take the pill and 9 are cured; but 8 would have been cured anyway. Ten take the pill, two would have been cured without it, but with the pill, only one is cured, so NNH=10. Very good drug 0.1 0.9 1.25 Satisfactory drug 0.3 0.7 2.5 High placebo effect 0.4 0.5 10 Low cure rate 0.8 0.9 10 Goes away by itself 0.1 0.2 10 Sabotages cure 0.9 0.8 10
Relative Risk The probability of an event occurring in an exposed group to the probability occurring in a non exposed group. Experimental group (E) Control Group (C) Events (E) EE CE Non events (N) EN CN Total subjects (S) ES CS Event rate (ER) EER CER
Relative Risk Relative Risk = ??? ??? Experimental group (E) Control Group (C) Events (E) EE CE Non events (N) EN CN Total subjects (S) ES CS Event rate (ER) EER CER
Odds Ratios A measure of association between an exposure and an outcome Experimental group (E) Control Group (C) Events (E) EE CE Non events (N) EN CN Total subjects (S) ES CS Event rate (ER) EER CER
Odds Ratios ?? ?? ?? ?? OR= Experimental group (E) Control Group (C) Events (E) EE CE Non events (N) EN CN Total subjects (S) ES CS Event rate (ER) EER CER
Example 200 rabbits are randomly allocated to two groups. They have all been exposed to a virus. 100 of the rabbits are given the treatment . 95 rabbits are cured. Of the 100 rabbits given a placebo, 10 are cured. Calculate the ARR, NNT, Relative risk and odds ratios.
Step 1 Experimental group (E) Control Group (C) Events (E) Non events (N) Total subjects (S) Event rate (ER)
Step 1 Experimental group (E) Control Group (C) Events (E) 95 10 Non events (N) 5 90 Total subjects (S) 100 100 Event rate (ER) 0.95 0.1
Step 2 How would you calculate ARR? ARR = EER-CER = 0.85=85% Experimental group (E) Control Group (C) Events (E) 95 10 Non events (N) 5 90 Total subjects (S) 100 100 Event rate (ER) 0.95 0.1
Step 2 How would you calculate NNT? 1 1 NNT = 0.85= 1.17 ??? ???= Experimental group (E) Control Group (C) Events (E) 95 10 Non events (N) 5 90 Total subjects (S) 100 100 Event rate (ER) 0.95 0.1
Step 2 How would you calculate relative risk? Relative Risk = ??? ???= 0.95 0.1= 9.5 Experimental group (E) Control Group (C) Events (E) 95 10 Non events (N) 5 90 Total subjects (S) 100 100 Event rate (ER) 0.95 0.1
Step 2 How would you calculate odds ratios? 95 5 10 90 ?? ?? ?? ?? = 19 0.11=171 OR= = Experimental group (E) Control Group (C) Events (E) 95 10 Non events (N) 5 90 Total subjects (S) 100 100 Event rate (ER) 0.95 0.1
Funnel plots http://www.bmj.com/content/343/bmj.d4002
Conclusion We covered some terminology and calculations involved in the AKT We also covered some diagrams and the interpretation of these diagrams
What else should I do? Go over section 2 of the AKT content guide. Do lots of practice questions. Learn the statistical terminology (59+ terms) Understand the principles of screening
What about the administration section? Oxford Handbook of GP first few chapters tells you most of what you need to know about section 3.
Learn (this is not an exhaustive list): - DVLA fitness to drive guidelines, - CAA fitness to fly guidelines, - Childhood imms schedule, - School exclusion guidelines, - Child development milestones, - UKMEC guidelines, - Emergency management, - Consultation models, - Any relevant CKS/NICE guidelines of common conditions.
Questions? Ideas? Concerns?? Expectations???


:")