State Transportation Department's Stormwater Monitoring Program Overview
This document presents findings and protocols from the National Cooperative Highway Research Program related to stormwater monitoring goals, objectives, and protocols for state departments of transportation. The project team, objectives, and report organization are outlined, aiming to provide guidance for designing effective monitoring programs. Key elements include literature review, monitoring goals, and protocols development.

Download Presentation

Please find below an Image/Link to download the presentation.
The content on the website is provided AS IS for your information and personal use only. It may not be sold, licensed, or shared on other websites without obtaining consent from the author.If you encounter any issues during the download, it is possible that the publisher has removed the file from their server.
You are allowed to download the files provided on this website for personal or commercial use, subject to the condition that they are used lawfully. All files are the property of their respective owners.
The content on the website is provided AS IS for your information and personal use only. It may not be sold, licensed, or shared on other websites without obtaining consent from the author.
E N D
Presentation Transcript
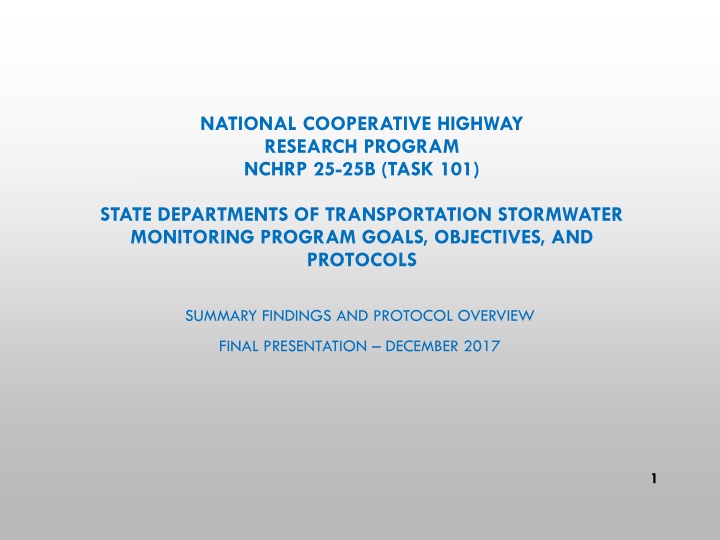
NATIONAL COOPERATIVE HIGHWAY RESEARCH PROGRAM NCHRP 25-25B (TASK 101) STATE DEPARTMENTS OF TRANSPORTATION STORMWATER MONITORING PROGRAM GOALS, OBJECTIVES, AND PROTOCOLS SUMMARY FINDINGS AND PROTOCOL OVERVIEW FINAL PRESENTATION DECEMBER 2017 1
PRESENTATION OVERVIEW PROJECT OVERVIEW PROJECT TEAM PROJECT OBJECTIVE REPORT ORGANIZATION STORMWATER MONITORING LITERATURE REVIEW MONITORING GOALS KEY ELEMENTS OF MONITORING MONITORING PROTOCOL 2
PROJECT OVERVIEW TASK 1: 1. Literature Review 2. Synthesis of Current Monitoring Goals 3. Interim Memo Report TASK 2: 1. Identify Key Monitoring Elements Based on Literature Review 2. Interim Memo Report TASK 3: 1. Develop Protocol for Each Identified Monitoring Goal 2. Draft Final Report TASK 4: 1. Final Report 2. PowerPoint 3
NCHRP 25-25B (TASK 101) PROJECT TEAM OVERSIGHT STUDY TEAM Ann Hartell, NCHRP Senior Program Officer Chin Lien, P.E.; D.WRE Principal Investigator Scott McGowen, Michael Baker International (Chair) Nancy Skinner QA/QC Henry Barbaro, Massachusetts DOT Kelley Moxley, P.E. - Researcher William Fletcher, Oregon DOT Antti Koskelo - Researcher Kenneth Stone, Washington State DOT Veronica Seyed - Researcher Nicklas Tiedeken, Minnesota DOT Susan Jones, FHWA Liaison 4
PROJECT OBJECTIVE Provide guidance to State DOTs in designing an effective monitoring program that is: Appropriate in scale and duration, Includes the appropriate parameters and pollutants of concern, and Meets the objectives of their specific stormwater sampling program. 5
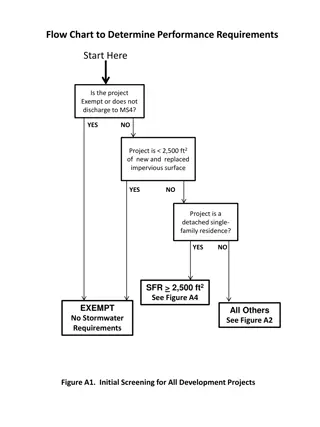
REPORT ORGANIZATION EXECUTIVE SUMMARY CHAPTER 1 - MONITORING GOALS CHAPTER 2 - IDENTIFY KEY MONITORING ELEMENTS ESSENTIAL FOR THE DEVELOPMENT OF AN EFFECTIVE DOT MONITORING PROGRAM CHAPTER 3 - EFFECTIVE MONITORING PROTOCOLS FOR A STATE DOT MONITORING PLAN ADDITIONAL RESOURCES 6
REPORT ORGANIZATION 7 *A Handout for this Figure will be provided.
STORMWATER MONITORING LITERATURE REVIEW Caltrans Stormwater Monitoring Guidance Manual - Caltrans (State of California Department of Transportation) State-of-the-Practice Report: Water Quality Monitoring - AASHTO S Stormwater Management Community of Practice (CoP) Handbook for Sampling and Sample Preservation of Water and Wastewater United States Environmental Protection Agency National Field Manual for the Collection of Water-Quality Data United States Geological Survey Sampling and Testing of Stormwater Runoff from North Carolina Highways North Carolina Department of Transportation 8
STORMWATER MONITORING LITERATURE REVIEW Urban Stormwater BMP Performance Monitoring Geosyntec Consultants and Wright Water Engineers Monitoring of Contaminants in Delaware Street Sweeping Residuals and Evaluation of Recycling/Disposal Options Delaware Department of Transportation Standard Operating Procedure for Automated Sampling for Stormwater Monitoring Federal Highway Administration Characterization of Highway Runoff in Austin, Texas Area University of Texas at Austin Minnesota Stormwater Manual Minnesota Pollution Control Agency Stormwater Sampling Manual Washington Department of Ecology 9
MONITORING GOALS GOAL 1 - Characterize Stormwater Runoff Quality GOAL 2 - Assess Best Management Performance (BMP) Performance GOAL 3 - TMDL Effectiveness Monitoring GOAL 4 - Evaluate Efficiency Of Routine Maintenance Activities 10
KEY ELEMENTS OF MONITORING MONITORING EQUIPMENT Precipitation Flow Sample Collection MONITORING STATION NETWORK Location Of Monitoring Stations Number Of Monitoring Stations WATER QUALITY POLLUTANTS STORM EVENT CRITERIA DURATION OF MONITORING HEALTH AND SAFETY PLAN NUMBER OF STORMS TO SAMPLE DATA ANALYSIS TECHNIQUE Data Validation Database Development Data Visualization SAMPLING METHODS Grab Sampling Automated Sampling QC PROCEDURES Composite Sampling 11
MONITORING PLAN GOAL 1 CHARACTERIZE STORMWATER RUNOFF QUALITY LOCATION OF MONITORING STATIONS: DOT Storm Drainage Network (Ditches, Curb Inlets, Catch Basins, Pipe Outfalls) NUMBER OF MONITORING STATIONS: Type of Monitoring Study Recommended Number of Monitoring Stations 10 to 50 stations, depending on the area of the state. 1 to 3 stations State-Wide Transportation Facility/Hotspot Highway Specific 3 to 5 stations* *Varies with diversity of the highway to be monitored as well as other factors for example eco regions, land use, TMDLs, and traffic counts. 12
MONITORING PLAN GOAL 1 CHARACTERIZE STORMWATER RUNOFF QUALITY WATER QUALITY POLLUTANTS1 Pollutant Category Pollutants Particulates TSS Nutrients Nitrogen TKN, NO3-2, NH3-N, Organic Nitrogen, TN Nutrients - Phosphorus TP, PO4 Metals Cadmium, Lead, Zinc, Copper, and Iron (total and dissolved) Bacteria E. Coli., Fecal Coliform, and Enterococcus TPH, Oil, and Grease Organic Contaminants PCBs (Total) PAHs (Total) General/Conventional Water Temperature, DO, Specific Conductivity, pH, Hardness, and TDS Herbicides Varies based on chemical control utilized De-Icing Chlorides, TDS, Conductivity 13 1Toxicity is discussed separately. See report for details.
MONITORING PLAN GOAL 1 CHARACTERIZE STORMWATER RUNOFF QUALITY DURATION OF MONITORING: 2 Years For States With At Least 30 Of Annual Rain Eastern U.S., Northern California, And Pacific Northwest 3 Years For States With Less Than 30 Of Annual Rain Western U.S. NUMBER OF STORMS TO SAMPLE: 10 Storms Per Year SAMPLING METHOD: Discrete (by Automated Sampler)* Flow-Weighted Composite *The term discrete is used here to differentiate from grab samples. Discrete in this context refers to samples that are collected by an automated sampler, as opposed to grab samples which are collected by hand. Discrete sampling by an automated sampler means collecting a series of individual samples for laboratory analysis to provide data on the within- storm variability of the water quality pollutants. 14
MONITORING PLAN GOAL 1 CHARACTERIZE STORMWATER RUNOFF QUALITY MONITORING EQUIPMENT*: *Applies to all goals Monitoring Parameter or Equipment Type Precipitation Flow Recommended Equipment tipping bucket rain gauge depends on nature of flow at monitoring station automated sampler (suggest refrigerated model in warm climates) laboratory bottles, powder-free nitrile gloves, cooler with ice, extension pole, intermediate container, chain of custody, pen cellular modem, antenna, vendor software, cellular phone account, data logger Power is only needed if using automated samplers. AC power is ideal. If not available, use a 12 V deep-cycle marine battery and possibly a solar array. Sample Collection Automated Sample Collection Grab Telemetry Power 15
MONITORING PLAN GOAL 1 CHARACTERIZE STORMWATER RUNOFF QUALITY STORM EVENT CRITERIA*: *Applies to all goals Arid or Semi-Arid Climates Storm Event Criteria Humid Climates Rainfall Depth Rainfall Duration Antecedent Dry Period1 Minimum 0.1 At least 1 hour At least 72 hours Minimum 0.1 At least 1 hour At least 24 hours Inter-Event Dry Period 10 hours 10 hours 1Dry period is defined as less than 0.04 in previous 6 hours. See Section 2.8 for details. 16
MONITORING PLAN GOAL 1 CHARACTERIZE STORMWATER RUNOFF QUALITY DATA ANALYSIS TECHNIQUE: Summary Table X Scatter Plot X Trend Plot X Goal Bar Graph Hyetograph Hydrograph Box Plot 1 X X X X Calculation of Pollutant Loads X Calculation of Treatment Efficiency Conducting Statistical Analysis X Conducting a Regression Analysis X Conduct a Trend Analysis X Calculation of EMCs Goal 1 X 17
MONITORING PLAN GOAL 2 ASSESS BMP PERFORMANCE LOCATION OF MONITORING STATIONS: Monitoring Locations Should Be Located At The Influent And Effluent Point(s) Of The BMP Being Monitored. Precise Location of Sampler Intake can Affect the Quality and Accuracy. See Section 1.1 for more information. NUMBER OF MONITORING STATIONS1: BMPs With A Single Influent And Effluent Point: 2 Monitoring Stations, One At Each BMPs With A Single Influent Point And No Effluent Point: 2 Monitoring Stations, One At Influent And One Interior BMPs With Multiple Influent Points And Multiple Effluent Points: Monitor At Each Influent And Effluent Point To Capture All Inflows And Outflows, Up To A Maximum Of 4 Monitoring Stations. BMPs With More Than 4 Influent And Effluent Locations Are Not Recommended For Monitoring. Treatment Train BMPs : Two Paired Inflow-outflow Stations For Each Individual Treatment Train Component. 18
MONITORING PLAN GOAL 2 ASSESS BMP PERFORMANCE WATER QUALITY POLLUTANTS1 Pollutant Category Pollutants Particulates TSS Nutrients Nitrogen TKN, NO3-2, NH3-N, Organic Nitrogen, TN Nutrients - Phosphorus TP, PO4 Metals Total and Dissolved Cadmium, Zinc, Copper, and Lead General/Conventional DO, temperature, pH, hardness, and TDS Bacteria Fecal Coliform and Enterococcus PAHs, Oil and Grease Organic Contaminants 1Toxicity is discussed separately. See report for details. 19
MONITORING PLAN GOAL 2 ASSESS BMP PERFORMANCE DURATION OF MONITORING: 2 Years For States With At Least 30 Of Annual Rain Eastern U.S., Northern California, And Pacific Northwest 3 Years For States With Less Than 30 Of Annual Rain Western U.S. NUMBER OF STORMS TO SAMPLE: 10 Storms Per Year SAMPLING METHOD: Flow-weighted Composite 20
MONITORING PLAN GOAL 2 ASSESS BMP PERFORMANCE MONITORING EQUIPMENT: See Slide 15 STORM EVENT CRITERIA: See Slide 16 DATA ANALYSIS TECHNIQUE: Summary Table X Scatter Plot Goal Bar Graph Hyetograph Hydrograph Box Plot Trend Plot 2 X X X X X Calculation of Runoff Volume Reductions X Calculation of Pollutant Loads Calculation of Treatment Efficiency Conducting Statistical Analysis Conducting a Regression Analysis Conduct a Trend Analysis Calculation of EMCs Goal 2 X X X X X 21
MONITORING PLAN GOAL 3 TMDL EFFECTIVENESS LOCATION OF MONITORING STATIONS: See Goals 1 and 2 NUMBER OF MONITORING STATIONS: TMDL Compliance Monitoring Applies To DOTs That Are Subject To TMDL Requirements. For These Dots, It Is Difficult To Recommend A Specific Number Or Even Range Of Stations Since It Differs Case By Case. Some Factors To Consider Include: 1) The relative contribution of pollutant loads of the DOT and size of the area to the impaired TMDL waterway. 2) The size of the area where stormwater treatment is needed to comply with the TMDL. 3) The heterogeneity of these areas. 4) How much monitoring is needed to populate and calibrate a water quality model for pollutant load analysis. 22
MONITORING PLAN GOAL 3 TMDL EFFECTIVENESS WATER QUALITY POLLUTANTS DEPENDENT ON THE NATURE OF THE IMPAIRMENTS IN THE LOCAL WATERWAYS Common TMDLs Include: Sediment Pathogens Nutrients Metals Pesticides/Toxics Bacteria Temperature Less Typical TMDLs Include: Biological Integrity Turbidity Fecal Coliform Selenium Chloride 23
MONITORING PLAN GOAL 3 TMDL EFFECTIVENESS DURATION OF MONITORING: 2 Years For States With At Least 30 Of Annual Rain Eastern U.S., Northern California, And Pacific Northwest 3 Years For States With Less Than 30 Of Annual Rain Western U.S. NUMBER OF STORMS TO SAMPLE: 10 Storms Per Year SAMPLING METHOD: Flow-weighted Composite 24
MONITORING PLAN GOAL 3 TMDL EFFECTIVENESS MONITORING EQUIPMENT: See Slide 15 STORM EVENT CRITERIA: See Slide 16 DATA ANALYSIS TECHNIQUE: Summary Table X Scatter Plot X Goal Bar Graph Hyetograph Hydrograph Box Plot Trend Plot 3 X X X X X Calculation of Pollutant Loads X Calculation of Treatment Efficiency X Conducting Statistical Analysis X Conducting a Regression Analysis X Conduct a Trend Analysis X Calculation of EMCs Goal 3 X 25
MONITORING PLAN GOAL 4 ROUTINE MAINTENANCE ACTIVITIES LOCATION OF MONITORING STATIONS: Herbicide Applications: Monitor At Centroid Of Herbicide Spray Area And Immediately Downslope Of The Spray Area. It Is Also Recommended To Monitor At A Control Site Where Herbicides Were Not Sprayed But All Other Conditions Are The Same. This Can Either Be At A Separate Location Nearby, Or Along The Road Shoulder Just Before Runoff Enters The Spray Area. De-icing/Salt Applications: Monitor Along The Road Shoulder Or In A Catch Basin Adjacent To Roads Where De-icing Materials Are Applied. Stations May Also Be Located At Bridge Decks Where Runoff Is Discharged Into A Downstream BMP. Street Sweeping/Catch Basin Clean-outs: Storm Drain Pipe Outfalls At The Base Of The Catchment Area Where Street Sweeping Occurs. Vegetation Maintenance (Mowing): Edge-of-pavement At The Road Shoulder, In The Centroid Of The Mowing Area, Immediately Downslope Of The Mowing Area. Note: Precise Location of Sampler Intake can Affect the Quality and Accuracy. See Section 1.1 for more information. 26
MONITORING PLAN GOAL 4 ROUTINE MAINTENANCE ACTIVITIES NUMBER OF MONITORING STATIONS: Type of Routine Maintenance Activity Recommended Number of Monitoring Stations 2 to 3 stations at control sites and 2 to 3 stations at treatment areas Herbicides1 De-icing/Salt Applications during Adverse Weather Conditions 2 per bridge crossing or 1 station per catchment Street Sweeping/Catch Basin Clean-Out 2 stations per monitoring study (1 station per catchment) Vegetation Maintenance (Mowing) 1 to 3 stations per mowing area 1The intent is to characterize the use of herbicides at the treatment site and compare the data to a control site where there is no use of herbicides to assess whether the use of herbicides could be a contributor to the load of herbicides. See page 12 of report. 27
MONITORING PLAN GOAL 4 ROUTINE MAINTENANCE ACTIVITIES WATER QUALITY POLLUTANTS Pollutant Category Pollutants Street Sweeping Catch Basin Clean- outs TSS, TDS, VSS, particle size distribution TSS, TDS, VSS, particle size distribution Varies depending on what herbicide was used for vegetation control (i.e. Glyphosate, Diuron, and etc.), hardness, temperature, pH Herbicide Applications Application of De- icing Materials Vegetation Maintenance (Mowing) Chloride, conductivity TSS, TDS, VSS, particle size distribution 28
MONITORING PLAN GOAL 4 ROUTINE MAINTENANCE ACTIVITIES DURATION OF MONITORING: 2 Years For States With At Least 30 Of Annual Rain Eastern U.S., Northern California, And Pacific Northwest 3 Years For States With Less Than 30 Of Annual Rain Western U.S. NUMBER OF STORMS TO SAMPLE: Variable: 5 to 10 Storms per Year SAMPLING METHOD: Flow-weighted Composite 29
MONITORING PLAN GOAL 4 ROUTINE MAINTENANCE ACTIVITIES MONITORING EQUIPMENT: See Slide 15 STORM EVENT CRITERIA: See Slide 16 DATA ANALYSIS TECHNIQUE: Summary Table X Scatter Plot Trend Plot Goal Bar Graph Hyetograph Hydrograph Box Plot 4 X X X Calculation of Pollutant Loads Calculation of Treatment Efficiency X Conducting Statistical Analysis Conducting a Regression Analysis Conduct a Trend Analysis Calculation of EMCs Goal 4 X 30
ADDITIONAL INFORMATION GLOSSARY ABBREVIATIONS REFERENCES APPENDICES SITE MAINTENANCE CALIBRATION AND TESTING OF EQUIPMENT LABORATORY METHODS 31
PROJECT FINAL REPORT AVAILABLE AT: HTTP://APPS.TRB.ORG/CMSFEED/TRBNETPR OJECTDISPLAY.ASP?PROJECTID=3970 32


")