Social Indicator Construction and Evaluation Process
Explore the process of constructing social indicators, evaluating their quality, and challenges faced in using survey data. Learn about different indicator types, criteria for quality, and comparisons between administrative and survey data. Dive into the characteristics of good indicators and key considerations in their use.

Download Presentation

Please find below an Image/Link to download the presentation.
The content on the website is provided AS IS for your information and personal use only. It may not be sold, licensed, or shared on other websites without obtaining consent from the author. If you encounter any issues during the download, it is possible that the publisher has removed the file from their server.
You are allowed to download the files provided on this website for personal or commercial use, subject to the condition that they are used lawfully. All files are the property of their respective owners.
The content on the website is provided AS IS for your information and personal use only. It may not be sold, licensed, or shared on other websites without obtaining consent from the author.
E N D
Presentation Transcript
Maatschappij, Beleid en Evaluatie Tim Goedem tim.goedeme@uantwerpen.be Les 5 27/10/2015
Lecture 5 The construction of social indicators 1. Different types of indicators 2. Quality criteria for social and policy indicators 3. Challenges of social indicators based on survey data: total survey error 4. Sampling errors 5. Non-sampling errors
Main questions What are the most important characteristics of good indicators? How can one define comparability? What are specific concerns when social indicators make use of survey data? What are the (dis)advantages of using administrative data vs. survey data?
Background texts Atkinson, A. B., Cantillon, B., Marlier, E., and Nolan, B. (2002), Social Indicators: the EU and Social Inclusion, Oxford: Oxford University Press, 240p. Chapter 2 [compulsory] Groves, R. M., Fowler, F. J. J., Couper, M. P., Lepkowski, J. M., Singer, E., and Tourangeau, R. (2009), Survey Methodology (Second edition), New Jersey: John Wiley & Sons, 461p. Chapter 2 [compulsory] Goedem , T. (2013), 'How much confidence can we have in EU-SILC? Complex sample designs and the standard error of the Europe 2020 poverty indicators' in Social Indicators Research, 110(1): 89-110. doi: 10.1007/s11205-011-9918-2. [background] Lohmann, H. (2011), 'Comparability of EU-SILC survey and register data: The relationship among employment, earnings and poverty' in Journal of European Social Policy, 21(1): 37-54. doi: 10.1177/0958928710385734. [Background]
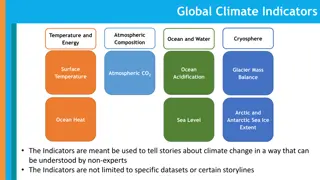
Part 1: Types of indicators An indicator = a summary statistic which tries to measure a phenomenon or a (past, current or future) state of affairs Types by policy cycle: Input indicators Output indicators Outcome indicators Policy indicators vs. social (outcome) indicators
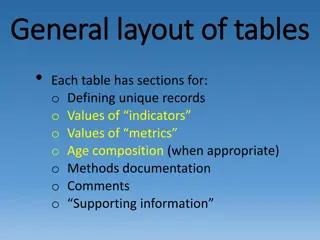
Dimensions of social programmes Dimension Question Important characteristics Risk or contingency What is the problem to solve? New vs. old social risks Prevention vs. curative Poverty vs. income maintenance Mode of access Who is protected, who receives? Universality vs. selectivity Caseload Non-take up Conditionalities Benefit structure Who receives what and how much? In-cash vs. in-kind Progressiveness Minima Means test Basis for calculation
Dimensions of social programmes (continued) Dimension Question Important characteristics Financing Who pays? Taxes vs. contributions Basis for calculation Non-compliance Funded vs. pay as you go Governance Who determines? Who manages? Who administers? Who executes? Role of the government Role of the private sector Role of the social partners and other interest groups Degree of centralisation
Types of indicators Mode of access: Coverage Number & distribution of beneficiaries (caseload) Direct + indirect beneficiaries Non take-up; sanctions Leakage
Types of indicators Benefit structure: Level of benefit in theory ( typical cases / hypothetical households) Level of benefit in practice (distribution -> incidental analysis + microsimulation) Progressiveness of benefit structure in theory (institutional measurement) & in practice (outcome measurement based on distribution in current population)
Types of indicators Financing: Distribution of costs (in theory and practice) Total amount of resources committed Resources per capita (beneficiaries) Short term vs. long-term cost; implicit debt
Types of indicators Dimensions: Winners and losers: who gets what? Who pays what? Non-intended consequences Eye for all relevant dimensions (social, economic, political, environmental, )
Some examples Input Output Outcome Financing Tariff structure Total taxes collected, average tax rate Distribution of taxes Mode of access Legal retirement age Average effective retirement age Dependency ratio Benefit structure Theoretical benefit level Average benefit level Distribution of benefits among the population Other important outcome indicators relate to: Unemployment, average effective marginal tax rate, poverty, inequality,
Part 2: Quality criteria Of individual indicators (Atkinson et al., 2002): Validity: an indicator should identify the essence of the problem and have a clear and accepted normative interpretation (Face validity, transparency & acceptability) Internal vs. external validity Reliability: an indicator should be robust and statistically validated Responsiveness: an indicator should be responsive to effective policy interventions but not subject to manipulation
Quality criteria Comparability (Goedem et al., 2015) Place & time: an indicator should be measurable in a sufficiently comparable way across member states Procedural comparability: the same procedures are implemented for measuring a phenomenon or characteristic at different occasions different times or different places Substantive comparability: the same phenomenon is captured similarly in different (social) contexts Operational feasibility, timeliness and potential for revision
Quality criteria For the portfolio of indicators (Atkinson et al., 2002): Balance across different dimensions (and be comprehensive but selective rather than exhaustive) Mutual consistency of indicators & proportionate weight of indicators Transparency and accessibility
Part 3: Challenges of social indicators based on survey data Source: Groves et al. (2004: 39)
random vs. non-random errors (bias) Groves et al. (2004: 48)
Crash course statistics: the sampling variance Some things that should be known to everyone producing or interpreting a sample estimate, but are not always taught in statistics courses
Basic idea Statistics are a powerful tool Need limited number of observations Point estimate and estimate of precision However, without an estimate of its precision, a point estimate is pointless!
Key Messages 1. If estimates are based on samples -> estimate and report SEs, CIs & p-values 2. Always take as much as possible account of sample design when estimating SEs, CIs & p-values 3. Never delete observations from the dataset 4. Never simply compare confidence intervals
Overview 1. The 4 big determinants of the sampling variance 2. (The ultimate cluster method) 3. Analysing subpopulations 4. Comparing point estimates 5. Conclusion
1. Sampling variance Sampling variance = variance of a survey statistic between independent, identical samples of the same population, i.e. the variance of a sampling distribution Standard error = (sampling variance)^0.5 In the absence of bias, the lower the variance, the more precise the point estimate will be
1. Sampling variance Determinants Shape of population distribution + everything from drawing the sample to calculation and level of the point estimate 4 big components: Sample design Weighting Imputation Characteristics of statistic of interest
1. Sampling variance Sample design Simple random sample Complex samples Stratification Clustering Multiple stages of selection (PSUs, SSUs, USUs) (un)equal probabilities of selection
1. Sampling variance Sample design Stratification: Divide population in non-intersecting groups (strata) Independent sample in each stratum Increases precision (representativeness more assured) Decreases sampling variance with between-stratum variance
1. Sampling variance Sample design Clustering: Within each stratum, divide elements in non-intersecting groups of elements, apply a random selection of these groups (i.e. clusters ) For pragmatical reasons In most cases decreases precision Increase in sampling variance depends on Rho Rho=intraclass correlation coefficient, i.e. the degree of cluster homogeneity
1. Sampling variance Sample design Multiple stages of selection: Whenever clusters are selected at the first stage (=> these clusters are the primary sampling units (PSUs) and the strata at this stage are primary strata) And at a subsequent stage within each selected PSU a further selection is made of (clusters) of elements The clusters of elements selected at the second stage are secondary sampling units (SSUs), and the (clusters of) elements selected at the final stage are the ultimate sampling units (USUs)
1. Sampling variance Sample design
1. Sampling variance Weighting 3 basic steps in weighting: Probability weighting Increase variance Adjustment to unit non-response Calibration Decreases variance
1. Sampling variance Imputation Imputation Item non-response Different methods (random, non-random) Special case: micro simulation studies Neglect leads usually to under-estimation of variance Easiest for researchers: multiple imputation
1. Sampling variance Statistic of interest Most common: Mean; total; proportion; ratio; regression coefficient; ... More complex: When measure is based on sample estimate: e.g. % of population with income below 60% of the median income in the sample Non-smooth inequality measures Solution for many estimates: DASP (Araar and Duclos, 2007)
1. Sampling variance So, 4 big determinants: Sample design Weighting Imputation Characteristics of statistic of interest => whichever approach to variance estimation (linearisation, bootstrap, regression-based, ) the 4 determinants should be taken into account by replicating as closely as possible all steps from drawing the sample until calculating the statistic of interest
Overview 1. The 4 big determinants of sampling variance 2. The ultimate cluster method 3. Analysing subpopulations 4. Comparing point estimates 5. Conclusion
(2. Ultimate cluster method) Only take account of the first stage of the sample design (stratification and clustering) Assume there is no subsampling within PSUs Assume sampling with replacement
(2. Ultimate cluster method) Why: ease of computation Second and subsequent stages add little variance if sampled fraction of PSUs is small (which is often the case but not always in EU-SILC, still an issue for further research)
(2. Ultimate cluster method) Need of good sample design variables to: Identify PSUs Identify Primary strata Take account of calibration (post-stratification, raking) More details in: Goedem , T. (2013), The EU-SILC Sample Design Variables, CSB Working Paper No. 13/02, Antwerp: CSB.
(2. Ultimate cluster method) Strata with one PSU: One of many PSUs selected (with respondents) -> join similar strata (on sampling frame) Self-representing PSU? -> PSU is stratum, use next stage of sample design as PSUs
(2. Ultimate cluster method) Remarks: Sample design variables should refer to moment of selection (not interview) PSU codes must at least be unique within strata Panels: use consistent PSU and strata codes Degrees of freedom: #PSUs-#Strata
(2. Ultimate cluster method) In Stata use sample design variables to identify the sample design svyset PSU [pweight = weight], strata(strata) Subsequently: svy: commands SPSS: CSPLAN & Complex sample commands R: survey package (svydesign and other commands) SAS: PROC SURVEYFREQ and others
Overview 1. The 4 big determinants of sampling variance 2. (The ultimate cluster method) 3. Analysing subpopulations 4. Comparing point estimates 5. Conclusion
3. Subpopulations Various types of subpopulations, which may be differently distributed across Strata and PSUs Size of subpopulation in sample may be random, not fixed (except if stratum) => additional source of random error!
3. Subpopulations DFs = #PSU(in stratum with n obs>=1) - #Strata(with n obs>=1) Reliability of estimates depends on number of observations AND how they are distributed across PSUs If variance within subsample is small, SE of small subpopulation is not necessarily very large
3. Subpopulations Conclusion: -> sample size extra source of random error! -> always check both the number of observations AND the number of PSUs with observations -> never drop cases from sample Instead: Create indicator variable Use the svy, subpop option (Stata) Use domain option in SAS
Overview 1. The 4 big determinants of sampling variance 2. The ultimate cluster method 3. Analysing subpopulations 4. Comparing point estimates 5. Conclusion


")


")
")
")
")
")
")