Social Demand and Cross-Scale Interactions in Central Texas Rivers
Diverse and valuable river ecosystems in Central Texas are experiencing a growing social demand, leading to city cross-scale connections and international tourist interest. A survey conducted among students, residents, and tourists revealed varying perceptions and values regarding ecosystem services and cultural demands within the San Marcos River social-ecological system.
Download Presentation

Please find below an Image/Link to download the presentation.
The content on the website is provided AS IS for your information and personal use only. It may not be sold, licensed, or shared on other websites without obtaining consent from the author.If you encounter any issues during the download, it is possible that the publisher has removed the file from their server.
You are allowed to download the files provided on this website for personal or commercial use, subject to the condition that they are used lawfully. All files are the property of their respective owners.
The content on the website is provided AS IS for your information and personal use only. It may not be sold, licensed, or shared on other websites without obtaining consent from the author.
E N D
Presentation Transcript
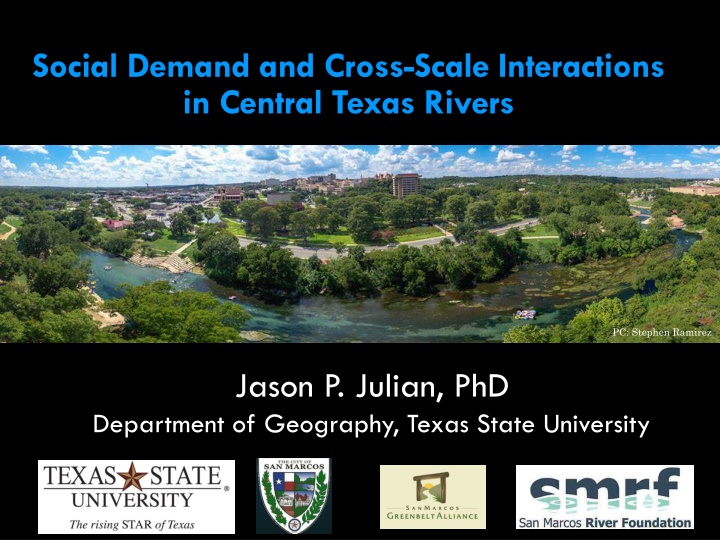
Social Demand and Cross-Scale Interactions in Central Texas Rivers PC: Stephen Ramirez Jason P. Julian, PhD Department of Geography, Texas State University
Diverse and Valuable River Ecosystems Many spring fed Cool, consistent flows Exceptional water quality Excellent habitat High biodiversity Many protected species
Central Texas Rivers are now international tourist destinations San Marcos R Toobers 2016
Social demand is growing! 5
City Cross-scale connections San Marcos River Region National/Global State
What are the social demands and cross- scale connections within the San Marcos River social-ecological system? Rivers Ecosystem Services Cultural Demands Social- Ecological System (SES) o Freshwater o Irrigation o Energy o Food o Habitat o Water quality o Flood regulation o Aesthetics o Education o Inspiration o Recreation o Sense of Place o Spirituality
Survey Methodology o Email, In-person, Mail-out questionnaires o Stratified random sampling to target different sociodemographic populations o Primarily forced, closed responses o 49 questions total o 20 minute average response time o Spring & Summer of 2015 o ~3,200 complete surveys Largely based on Castro et al. (2016)
2,581 Students 336 Residents 240 Tourists Students Residents Tourists Moderate usage High usage, but Targeted Seasonal usage Value skewed towards conservation Value heightened overall Value changes with experience Perception more limited Perception more sensitive Perception more generalized
Ecosystem Service Importance Ranking ?? statistic (df) 29.40(3)*** Ecosystem service p-value Post hoc summary Tourists rank slightly higher than students and residents Tourists rank slightly higher than students and residents Tourists and residents rank higher than students Students rank slightly higher than tourists No significant differences Students rank higher than residents and tourists; residents rank higher than tourists Water source <0.001 Food source 18.25(2)*** <0.001 Water quality 17.53(2)*** <0.001 Habitat 5.22(2)^ 0.074 Recreation Sense of place 0.01(2) 74.97(2)*** 0.996 <0.001
Cultural Ecosystem Service Importance Ranking ?? statistic (df) 13.50(2)** Cultural ES p-value Post hoc summary Sense of Place 0.001 Tourists (median=3) rank significantly lower than students and residents (median=4) Residents (median=4) rank significantly lower than students and tourists (median=5) Residents rank slightly higher than students; no other pairwise differences No significant differences No significant differences No significant differences Recreation 23.44(2)*** <0.001 Spirituality 7.77(2)* 0.021 Aesthetics Education Inspiration 1.29(2) 1.41(2) 0.12(2) 0.542 0.494 0.94
Social-Ecological Systems analysis Contact recreation most popular from group analyses Cultural activities ranked high for many residents New stakeholder groups emerged: Students divided between residents and regional Tourists divided between regional and non-regional
If the San Marcos River became dirty or cloudy, would you still use and enjoy it the way you do now? I would avoid the river if it was dirty or cloudy User Group Enjoy Same Enjoy Less No Effect Greatly Reduced Avoid River Non-regional Tourists 27.27 5.19 28.57 18.18 20.8 My use of the river would be greatly reduced Regional Students 4.4 21.10 2.74 41.37 30.41 Regional Tourists 8.5 20.38 2.84 45.97 22.27 Non-student Residents 5.4 25.47 1.69 47.75 19.66 Student Residents 5.0 24.00 1.77 48.07 21.12 The cleanliness and clarity of the river has no effect on my use/enjoyment I would still enjoy the river, but less than I do now I would continue to use or enjoy the river the way I do now Regional Non-regional Regional Non-student Resident Student Student Tourist Resident Tourist Chi-square test for independence: ?216 = 67.53; ? 0.0001
Summary of Key Findings and Cross-scale Interactions Region / students Overuse may lead to lower water quality and result in a move to a cleaner river San Marcos River Visitors City / residents Overuse may lead to lower water quality and cause a decrease in the well-being of residents, though not necessarily in the flow of residents to the river Non-region / tourists Portion of users who would avoid the river if it became dirty or overcrowded Overuse may lead to lower water quality, which will not substantively affect the flow of nonregional tourists to the river
