Social Data Analysis in Election Predictions


Examine and Predict Election
Results under your own steam
Exploring Data: Social Characteristics and Voting Behaviour
University of Glasgow Q-Step Centre
Quantitative Data and the Social Sciences
What is a social scientist? What do social scientists do?
Part of our work is to collect information about the social world or otherwise known as
data.
How do you understand the term data?
What types of data do social scientists work with?
Qualitative data: what is this?
Quantitative data: what is this?
Quantitative Data and the Social Sciences
Where does quantitative data come from?
Primary data : collecting sample data through surveying and
questionnaires
Secondary data: data already collected- available publicly to be reused.
Data are organised in categories called
variables
Quantitative Data and the Social Sciences
What do we do with that data?
Attempt to understand a social phenomenon
Why events happen
When events happen
What traits matter more/less
Today’s Data
British Elections Survey data using our online application to look at the voters’
characteristics and link these attributes to voting intention/behaviour using our
online application:
https://shiny.maths-stats.gla.ac.uk/nd29c/BESapp/
Identifying key characteristics of voters
Locating potential relationships between voter characteristics and voting
intentions/behaviour
Generating hypotheses about relationships between voter traits and voter
preferences
variables/characteristics included: check your handout/ the app
(3 mins)
Variables
Party Vote: Which Party you voted for
General party Vote: which party do you affiliate with politically
Brexit Vote: How did you vote in the EU Referendum
Second Brexit Vote: if there was a second referendum
Scottish Referendum: How did you vote?
EUview: Which of these comes closest to your own views on a scale from 1-10 Britain Should: 1=
do all it can to fully unite with Eu 10 =do all it can to protect its independence.
Gender
Region
Political Ideology: on a scale from 1- 10 where 1 is left and 10 is right, where do you place yourself
on the political spectrum.
Immigration & Economy: on a scale from 1-7 where 1 bad for the economy and 7 is good for the
economy, what is your opinion on Immigration and Economy.
College Education: What Qualifications do you have
Average Income: What is your average income
Age: age bands
How do we use data
To talk about our sample ( what is a sample?):
What do we see happening based on the data we have access to:
Are there any relationships/connections/patterns?
What is the most likely outcome? Can we predict what happens?
What traits help us predict different outcomes
To talk about the population (all possible observations) :
Using probability, we can talk about how likely it is that different traits influence all our
observations
Measures of Central Tendency
Mode, Median, Mean
Your best guess of what an observation will look like is the most
commonly/frequently observed value
:
Mode
Why might we care?
(1 observation versus 20 versus +200)
Modal Value
Modal Value
How do you locate it?
Count the number of cases in each category See which category has the
most values
Calculating the Mode
Respondent 1 Yes
2 Yes
3 No
4 No
5 Yes
6 No
7 Yes
8 No
9 Yes
10 No
11 Yes
12 Yes
13 No
14 Yes
15 Yes
16 Yes
17 Yes
18 Yes
19 No
20 No
21 No
22 No
23 Yes
24 No
25 No
What is the modal case?
Take 2 minutes to locate it in the
following list: check your handout also
Yes:15, No:12
Mean Value
Average Value for a set of observations:
A common technique we use on a day-to-day basis Comparing prices; what is expensive
what is cheap
Is a particular salary low or high
On average, what do you expect to see?
Examples: Life Expectancy
Unemployment Rate
Voter turnout
Government Spending
Seasonal or regional temperatures
Calculating the Mean
Mean Value Calculation Example
Respondent Age
1.
18
2.
18
3.
24
4.
20
5.
25
6.
19
7.
18
8.
19
9.
27
10.
20
11.
19
12.
18
13.
19
14.
18
15.
46
16.
26
17.
35
18.
37
19.
18
20.
19
21.
19
22.
20
23.
23
24.
19
25.
33
Example: Mean age of a class
What is the mean value
?
Take two minutes to calculate
Check your handout
23.29
Mean Value Warning
Mean values can be biased
How? Mean values can be made larger or smaller based on a few atypical
observations
Example- Annual Income
Example- Annual Income
Observation
1 20,000
2 25,000
3 18,000
4 30,000
5 28,000
6 500,000
What is the mean value? £103,500
Why is this misleading?
Median Value
Value that is in the middle
It is the value that cuts your observations into two halves, 50% of your
observations will be above and below
It is not biased by extremely large or small values
How do you locate it?
Order cases from largest to smallest Find the value that is halfway
Calculating the Median Value
Example-Liberal Conservative Self-Placement Scale
Ranges from 1-7 (1 Very Liberal, 7 Very Conservative)
What is the median value?
4, 1, 3, 4, 5, 6, 3,
Arrange Values from smallest to largest 1, 3, 3, 4, 4, 5, 6
Locate the middle observation 1, 3, 3, 4, 4, 5, 6
1, 3, 3,
4,
4, 5, 6
Lets check at the app.
Find the median and mode of the variables age and
education
Now look at the EU view? What is the median, and
mean?
What do these numbers show?
Range
Example-UK Expenditures on Social
Protection
Year Expenditure £
2000 144,540
2001 155,124
2002 164,924
2003 177,209
2004 188,248
2005 197,597
2006 203,847
2007 215,446
2008 229,984
2009 250,932
2010 262,563
Mean Value= $199,128.55
What is the range?
Differences between smallest and
largest observation
Range = MaximumValue –
MinimumValue
What is the range?
262,563-144,540=118,023
Why can it be useful?
Visual Guide to Looking at Data
You can examine your data numerically
Measures of Central Tendency
Or, you can examine your data visually
Bar Charts
Distribution of Data
Let’s take the example of Party Vote on our app;
Are observations clustered together?
Are observations spread out over the range of possible values?
Which values are observed the most?
In groups check the charts for variables income, Immigration and Economy
and Political ideology, what can you see? Is visual representation useful?
Why?
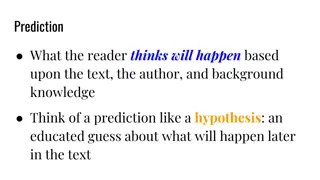
Hypotheses
Research usually is not just about individual variables, traits, or concepts
We are interested in how things interact with each other
Based on research, observation, and even intuition we develop ideas
about how things work
These ideas are our hypotheses
Then using data we test, if these hypotheses hold up and how well an idea
works
Hypotheses
Hypotheses come in a variety of forms
Equations, Words
Hypotheses can indicate different types of expectations:
Two things are related to one another
Two things are related in a positive-way
Two things are related in a negative way
Time spent studying and exam scores
Many other possible outcomes
Tasks
Looking at the set of variables in the app, think about which
concepts/variables you think might be related to one another ?
Then decide if you have any reasonable expectation about how these
concepts are related
Positive Relationship/ Negative Relationship
What types of relationships do you think might exist?
Tasks
Using the comparison tab examine the bar -charts for paired relationships
you listed in the above question.
Does the pattern in the chart support the direction of the relationship you
expected to see between the variables?
How strong is the relationship between the variables?
Overall, do you believe you found evidence to support your hypothesised
relationships?
Extra Task
Click on the Brexit comparisons Tab
For the first set of comparison chose Brexit Vote and Gender
Add percentages
Explain what you see? Do you think there is significant difference between how me and
women voted?
Second set of comparisons: Vote Pty and Vote EU
Any patterns there?
Explore social characteristics and voting behavior through quantitative data analysis at the University of Glasgow's Q-Step Centre. Learn about the types of data, where it comes from, and how social scientists use it to understand voter characteristics and voting intentions. Dive into British Elections Survey data to identify key voter traits and relationships between characteristics and voting behavior.

Download Presentation

Please find below an Image/Link to download the presentation.
The content on the website is provided AS IS for your information and personal use only. It may not be sold, licensed, or shared on other websites without obtaining consent from the author.If you encounter any issues during the download, it is possible that the publisher has removed the file from their server.
You are allowed to download the files provided on this website for personal or commercial use, subject to the condition that they are used lawfully. All files are the property of their respective owners.
The content on the website is provided AS IS for your information and personal use only. It may not be sold, licensed, or shared on other websites without obtaining consent from the author.
E N D
Presentation Transcript
Examine and Predict Election Results under your own steam Exploring Data: Social Characteristics and Voting Behaviour University of Glasgow Q-Step Centre
Quantitative Data and the Social Sciences What is a social scientist? What do social scientists do? Part of our work is to collect information about the social world or otherwise known as data. How do you understand the term data? What types of data do social scientists work with? Qualitative data: what is this? Quantitative data: what is this?
Quantitative Data and the Social Sciences Where does quantitative data come from? Primary data : collecting sample data through surveying and questionnaires Secondary data: data already collected- available publicly to be reused. Data are organised in categories called variables
Quantitative Data and the Social Sciences What do we do with that data? Attempt to understand a social phenomenon Why events happen When events happen What traits matter more/less
Todays Data British Elections Survey data using our online application to look at the voters characteristics and link these attributes to voting intention/behaviour using our online application: https://shiny.maths-stats.gla.ac.uk/nd29c/BESapp/ Identifying key characteristics of voters Locating potential relationships between voter characteristics and voting intentions/behaviour Generating hypotheses about relationships between voter traits and voter preferences variables/characteristics included: check your handout/ the app (3 mins)
Variables Party Vote: Which Party you voted for General party Vote: which party do you affiliate with politically Brexit Vote: How did you vote in the EU Referendum Second Brexit Vote: if there was a second referendum Scottish Referendum: How did you vote? EUview: Which of these comes closest to your own views on a scale from 1-10 Britain Should: 1= do all it can to fully unite with Eu 10 =do all it can to protect its independence. Gender Region Political Ideology: on a scale from 1- 10 where 1 is left and 10 is right, where do you place yourself on the political spectrum. Immigration & Economy: on a scale from 1-7 where 1 bad for the economy and 7 is good for the economy, what is your opinion on Immigration and Economy. College Education: What Qualifications do you have Average Income: What is your average income Age: age bands
How do we use data To talk about our sample ( what is a sample?): What do we see happening based on the data we have access to: Are there any relationships/connections/patterns? What is the most likely outcome? Can we predict what happens? What traits help us predict different outcomes To talk about the population (all possible observations) : Using probability, we can talk about how likely it is that different traits influence all our observations
Measures of Central Tendency Mode, Median, Mean Your best guess of what an observation will look like is the most commonly/frequently observed value: Mode Why might we care? (1 observation versus 20 versus +200)
Modal Value Modal Value How do you locate it? Count the number of cases in each category See which category has the most values
Respondent 1 Yes 2 Yes Calculating the Mode 3 No 4 No 5 Yes What is the modal case? 6 No 7 Yes 8 No 9 Yes Take 2 minutes to locate it in the following list: check your handout also 10 No 11 Yes 12 Yes 13 No 14 Yes 15 Yes 16 Yes 17 Yes 18 Yes 19 No 20 No 21 No 22 No 23 Yes 24 No 25 No
Mean Value Average Value for a set of observations: A common technique we use on a day-to-day basis Comparing prices; what is expensive what is cheap Is a particular salary low or high On average, what do you expect to see? Examples: Life Expectancy Unemployment Rate Voter turnout Government Spending Seasonal or regional temperatures
Calculating the Mean How do you locate it? Add up all your values and divide by the number of observations ?? ? x = X is a generic letter used to represent a variable X could be Age, Income, Fees, etc. x =Mean for variable X =Sum up(add together) all observations Xi =All observations in variable X n=the total number of observations
Respondent Age 1. 18 2. 18 Mean Value Calculation Example 3. 24 4. 20 5. 25 6. 19 7. 18 Example: Mean age of a class 8. 19 9. 27 10. 20 11. 19 What is the mean value? 12. 18 13. 19 14. 18 Take two minutes to calculate 15. 46 16. 26 17. 35 Check your handout 18. 37 19. 18 20. 19 21. 19 22. 20 23. 23 24. 19 25. 33
577 25=23.29 23.29
Mean Value Warning Mean values can be biased How? Mean values can be made larger or smaller based on a few atypical observations Example- Annual Income
Example- Annual Income Observation 1 20,000 2 25,000 3 18,000 4 30,000 5 28,000 6 500,000 What is the mean value? 103,500 Why is this misleading?
Median Value Value that is in the middle It is the value that cuts your observations into two halves, 50% of your observations will be above and below It is not biased by extremely large or small values How do you locate it? Order cases from largest to smallest Find the value that is halfway
Calculating the Median Value Example-Liberal Conservative Self-Placement Scale Ranges from 1-7 (1 Very Liberal, 7 Very Conservative) What is the median value? 4, 1, 3, 4, 5, 6, 3, Arrange Values from smallest to largest 1, 3, 3, 4, 4, 5, 6 Locate the middle observation 1, 3, 3, 4, 4, 5, 6
Lets check at the app. Find the median and mode of the variables age and education Now look at the EU view? What is the median, and mean? What do these numbers show?
Example-UK Expenditures on Social Protection Year Expenditure 2000 144,540 2001 155,124 2002 164,924 2003 177,209 2004 188,248 2005 197,597 2006 203,847 2007 215,446 2008 229,984 2009 250,932 2010 262,563 Mean Value= $199,128.55 Range What is the range? Differences between smallest and largest observation Range = MaximumValue MinimumValue What is the range? 262,563-144,540=118,023 Why can it be useful?
Visual Guide to Looking at Data You can examine your data numerically Measures of Central Tendency Or, you can examine your data visually Bar Charts
Distribution of Data Let s take the example of Party Vote on our app; Are observations clustered together? Are observations spread out over the range of possible values? Which values are observed the most? In groups check the charts for variables income, Immigration and Economy and Political ideology, what can you see? Is visual representation useful? Why?
Hypotheses Research usually is not just about individual variables, traits, or concepts We are interested in how things interact with each other Based on research, observation, and even intuition we develop ideas about how things work These ideas are our hypotheses Then using data we test, if these hypotheses hold up and how well an idea works
Hypotheses Hypotheses come in a variety of forms Equations, Words Hypotheses can indicate different types of expectations: Two things are related to one another Two things are related in a positive-way Two things are related in a negative way Time spent studying and exam scores Many other possible outcomes
Tasks Looking at the set of variables in the app, think about which concepts/variables you think might be related to one another ? Then decide if you have any reasonable expectation about how these concepts are related Positive Relationship/ Negative Relationship What types of relationships do you think might exist?
Tasks Using the comparison tab examine the bar -charts for paired relationships you listed in the above question. Does the pattern in the chart support the direction of the relationship you expected to see between the variables? How strong is the relationship between the variables? Overall, do you believe you found evidence to support your hypothesised relationships?
Extra Task Click on the Brexit comparisons Tab For the first set of comparison chose Brexit Vote and Gender Add percentages Explain what you see? Do you think there is significant difference between how me and women voted? Second set of comparisons: Vote Pty and Vote EU Any patterns there?