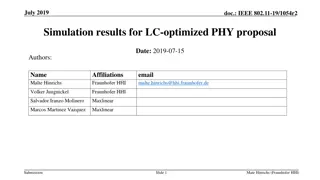
Simulation of LTE-V and WAVE Performance Metrics


Simulation of LTE-V and WAVE
Date:
2018-11-07
Authors:


Abstract
•
This
proposal
introduces performance metrics
for LTE
V2X
, and
provide PRR simulation results
of
LTE
V2X and WAVE in
similar conditions.
•
The simulation result indicates the necessity of improving WAVE
in typical scenarios.
LTE V2X
•
In LTE V2X, PRR and latency are used to evaluate system performance[1].
–
Packet Reception Ratio (PRR):
•
For one Tx packet, the PRR is calculated by X/Y, where Y is the number of UE/vehicles that located in the
range (a, b)
from the TX, and X is the number of UE/vehicles with successful reception among Y.
•
Average PRR, calculated as (X1+X2+X3….+Xn)/(Y1+Y2+Y3…+Yn) where n denotes the number of
generated messages in simulation. with
a = i*20 meters, b = (i+1)*20 meters for i=0, 1, …, 25
–
Latency:
•
latency components include: L-RRC,L-paging, L-SL_config, L-UL,L-RSU, ... etc.. And the overall
latency of each scenario can be decomposed into selective combination of the latency components.
•
This proposal focuses on PRR simulation result comparation between LTE V2X
and WAVE.
Simulation Assumptions (LTE V2X)
Simulation Assumptions (WAVE)
Mobility Model
Freeway
urban
Traffic Model
•
T
wo traffic models
exist in LTE V2X
:
–
Periodic traffic
•
This traffic model is used in our simulation.
–
Event-triggered
:
event arrival follows Poisson process with the arrival rate X per second for each
vehicle. Once event triggered, 6 messages are generated with space of 100ms. Working assumption
of message size for Event-trigger traffic at L1 is 800bytes.
Channel Model
•
LTE V2X UE to UE,WAVE
•
LTE V2X UE to eNB
Simulations
Y axis: Packet Reception Ratio (PRR)
X axis: i
a = i*20 meters, b = (i+1)*20 meters,
i=0~25,see slide 3
.
•
Both in LTE V2X mode3 and mode4 ,a packet goes through initial transmission and one time
retransmission.Thus in the simulation , one time retransmission is also added to WAVE for fairness.
•
The simulation results shows that in each scenario, mode3 performs better than mode4.This because
UEs in
mode4 select resources by performing channel sensing like WLA
N,whereas UEs in mode3 depend on eNB
resource scheduling ,which avoids collision between UEs in the same cell.
•
The results also shows that LTE V2X's PRR performance is better than WAVE' s under same mobility model
,traffic model and channel model. The reasons may lie in :
–
The difference of channel sensing mechnism: in WAVE system, STAs do channel sensing on a bandwidth of 10MHz,where in
LTE V2X ,the 10MHz channel is divided into subchannels,and UEs do channel sensing on each subchannel for channel access
opportunity.
–
In mode4 resource selection procedure , if the number of candidate single-subframe resources is smaller than 20% of the total
number of the candidate single-subframe resources, then
thresPSSCH-RSRP is
increased by 3 dB and this can be repeated till
the
number of candidate single-subframe resources is >=20% of total. This makes sure mode 4 UE can always select available RBs
once it contends for channel access.
Observations
Conclusion
•
PRR simulation results for WAVE and LTE V2X under same simulation assumption are shown in this
proposal,including two scenarios(Urban and Freeway) of different speeds.
•
By the observation of the curves,
PRR for LTE V2X is bettter than that of WAVE under specific
scenarios.
•
WAVE should improve its performance for be
tter collision avoidence and transmission reliability for
V2X traffic.
Reference
[1]36885-e00,3rd Generation Partnership Project;Technical Specification Group
Radio Access Network;Study on LTE-based V2X Services;(Release 14)
[2]36.213 V14.0.0
[3]36.211 V14.0.0
[4]36.212 V14.0.0
This proposal discusses the simulation results and performance metrics for LTE-V2X and WAVE technologies, focusing on Packet Reception Ratio (PRR) and latency evaluation. The document compares the PRR and latency of LTE-V2X and WAVE in similar scenarios, highlighting the need for enhancements in WAVE technology.

Download Presentation

Please find below an Image/Link to download the presentation.
The content on the website is provided AS IS for your information and personal use only. It may not be sold, licensed, or shared on other websites without obtaining consent from the author.If you encounter any issues during the download, it is possible that the publisher has removed the file from their server.
You are allowed to download the files provided on this website for personal or commercial use, subject to the condition that they are used lawfully. All files are the property of their respective owners.
The content on the website is provided AS IS for your information and personal use only. It may not be sold, licensed, or shared on other websites without obtaining consent from the author.
E N D
Presentation Transcript
Nov 2018 doc.: IEEE 802.11-18/1964r0 Simulation of LTE-V and WAVE Date: 2018-11-07 Authors: Name Affiliation Address Email Li Nan ZTE No.9 Wu Xing Section Xi Feng Road Xi an, Shaanxi Province P.R.China li.nan25@zte.com.cn Corporation Sun Bo sun.bo1@zte.com.cn HanZhiqiang han.zhiqiang1@zte.com.cn Wei Ning wei.ning@zte.com.cn Lv Kaiying lv.kaiying@zte.com.cn Submission Nan Li (ZTE) Slide 1
Nov 2018 doc.: IEEE 802.11-18/1964r0 Abstract This proposal introduces performance metrics for LTE V2X, and provide PRR simulation results of LTE V2X and WAVE in similar conditions. The simulation result indicates the necessity of improving WAVE in typical scenarios. Submission Nan Li (ZTE) Slide 2
Nov 2018 doc.: IEEE 802.11-18/1964r0 LTE V2X In LTE V2X, PRR and latency are used to evaluate system performance[1]. Packet Reception Ratio (PRR): For one Tx packet, the PRR is calculated by X/Y, where Y is the number of UE/vehicles that located in the range (a, b) from the TX, and X is the number of UE/vehicles with successful reception among Y. Average PRR, calculated as (X1+X2+X3 .+Xn)/(Y1+Y2+Y3 +Yn) where n denotes the number of generated messages in simulation. with a = i*20 meters, b = (i+1)*20 meters for i=0, 1, , 25 Latency: latency components include: L-RRC,L-paging, L-SL_config, L-UL,L-RSU, ... etc.. And the overall latency of each scenario can be decomposed into selective combination of the latency components. This proposal focuses on PRR simulation result comparation between LTE V2X and WAVE. Submission Nan Li (ZTE) Slide 3
Nov 2018 doc.: IEEE 802.11-18/1964r0 Simulation Assumptions (LTE V2X) LTE V2X Parameter Assumption Carrier frequency 5.9GHz Bandwidth 10MHz eNB transmit power 46dBm SPS period 100ms Time gap between Tx and ReTx 1~15ms Tx antenna gain 3dBi Rx antenna gain 3dBi Noise figure 9dB Urban:WINNER+ B1 Manhattan grid layout Freeway: LOS in WINNER+ B1 Pathloss model UE Maximum transmit power 23dBm scenario Freeway , Urban Freeway:3 in each direction ,Lane width:4m Urban:2 in each direction Lane width:3.5 m mobility model Resource reselection counter random value numSubchannel 6 Resource reservation 1 thresPSSCH-RSRP -128dBm restrictResourceReservationPeriod 1 Submission Nan Li (ZTE) Slide 4
Nov 2018 doc.: IEEE 802.11-18/1964r0 Simulation Assumptions (WAVE) WAVE Parameter Assumption Carrier frequency Bandwidth CCAThreshold 5.9GHz 10MHz -85dBm channel access mode default(channel access on CCH) EnergyDetectionThreshold Tx antenna gain Rx antenna gain -65dBm 3dBi 3dBi Noise figure 9dB Urban:WINNER+ B1 Manhattan grid layout Freeway: LOS in WINNER+ B1 23dBm Pathloss model Maximum transmit power scenario Freeway , Urban mobility model Freeway:3 in each direction ,Lane width:4m Urban:2 in each direction Lane width:3.5 m Submission Nan Li (ZTE) Slide 5
Nov 2018 doc.: IEEE 802.11-18/1964r0 Mobility Model Freeway urban Lane width Lane width: : 3 3. .5 5m m Sidewalk width Sidewalk width: : 3 3m m ISD=1732 m Road grid Road grid Street width Street width: : 20 20m m Wrapping around region Simulation region=2ISD=3464m Wrapping around region 433 433m m 250 250m m Submission Nan Li (ZTE) Slide 6
Nov 2018 doc.: IEEE 802.11-18/1964r0 Traffic Model Two traffic models exist in LTE V2X : Periodic traffic Index Vehicle dropping scenarios Absolute vehicle speed (km/h) Message generation period (ms) 100 1 Freeway 140 2 Freeway 70 100 3 Urban 60 100 This traffic model is used in our simulation. Event-triggered :event arrival follows Poisson process with the arrival rate X per second for each vehicle. Once event triggered, 6 messages are generated with space of 100ms. Working assumption of message size for Event-trigger traffic at L1 is 800bytes. Submission Nan Li (ZTE) Slide 7
Nov 2018 doc.: IEEE 802.11-18/1964r0 Channel Model LTE V2X UE to UE,WAVE Urban case Urban case Freeway case Freeway case WINNER+ B1 Manhattan grid layout (note that the antenna height should be set to 1.5 m.). Pathloss at 3 m is used if the distance is less than 3 m. IMT-A UMi NLOS clustered delay line models (CDL) model LOS in WINNER+ B1 (note that the antenna height should be set to 1.5 m.). Pathloss at 3 m is used if the distance is less than 3 m. Pathloss model Small Scale Parameters Model LTE V2X UE to eNB Urban case Urban case Freeway case Freeway case 128.1 + 37.6log10(R), R in kilometers Pathloss model UMi NLOS Small Scale Parameters Model Submission Nan Li (ZTE) Slide 8
Nov 2018 doc.: IEEE 802.11-18/1964r0 Simulations Y axis: Packet Reception Ratio (PRR) X axis: i a = i*20 meters, b = (i+1)*20 meters,i=0~25,see slide 3. Submission Nan Li (ZTE) Slide 9
Nov 2018 doc.: IEEE 802.11-18/1964r0 Observations Both in LTE V2X mode3 and mode4 ,a packet goes through initial transmission and one time retransmission.Thus in the simulation , one time retransmission is also added to WAVE for fairness. The simulation results shows that in each scenario, mode3 performs better than mode4.This because UEs in mode4 select resources by performing channel sensing like WLAN,whereas UEs in mode3 depend on eNB resource scheduling ,which avoids collision between UEs in the same cell. The results also shows that LTE V2X's PRR performance is better than WAVE' s under same mobility model ,traffic model and channel model. The reasons may lie in : The difference of channel sensing mechnism: in WAVE system, STAs do channel sensing on a bandwidth of 10MHz,where in LTE V2X ,the 10MHz channel is divided into subchannels,and UEs do channel sensing on each subchannel for channel access opportunity. In mode4 resource selection procedure , if the number of candidate single-subframe resources is smaller than 20% of the total number of the candidate single-subframe resources, then thresPSSCH-RSRP is increased by 3 dB and this can be repeated till the number of candidate single-subframe resources is >=20% of total. This makes sure mode 4 UE can always select available RBs once it contends for channel access. Submission Nan Li (ZTE) Slide 10
Nov 2018 doc.: IEEE 802.11-18/1964r0 Conclusion PRR simulation results for WAVE and LTE V2X under same simulation assumption are shown in this proposal,including two scenarios(Urban and Freeway) of different speeds. By the observation of the curves, PRR for LTE V2X is bettter than that of WAVE under specific scenarios. WAVE should improve its performance for better collision avoidence and transmission reliability for V2X traffic. Submission Nan Li (ZTE) Slide 11
Nov 2018 doc.: IEEE 802.11-18/1964r0 Reference [1]36885-e00,3rd Generation Partnership Project;Technical Specification Group Radio Access Network;Study on LTE-based V2X Services;(Release 14) [2]36.213 V14.0.0 [3]36.211 V14.0.0 [4]36.212 V14.0.0 Submission Nan Li (ZTE) Slide 12