Shallow Habitats Data Analysis & Project Updates
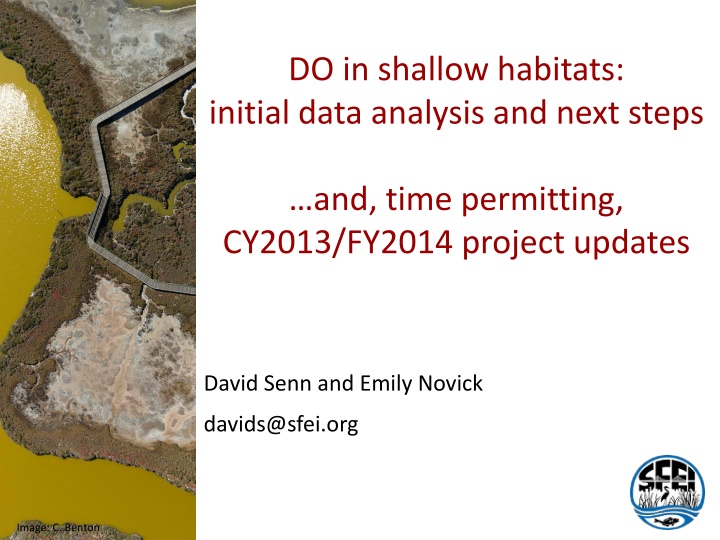
Conducting initial data analysis in shallow habitats to understand factors affecting phytoplankton composition and dissolved oxygen levels. Priority issues include assessing biomass signals, harmful algal blooms, and the role of nutrients. Key questions focus on low dissolved oxygen impact on fish and benthos in sloughs and former salt ponds of LSB. Efforts include data gathering and mechanistic analysis to address these critical environmental concerns.

Download Presentation

Please find below an Image/Link to download the presentation.
The content on the website is provided AS IS for your information and personal use only. It may not be sold, licensed, or shared on other websites without obtaining consent from the author.If you encounter any issues during the download, it is possible that the publisher has removed the file from their server.
You are allowed to download the files provided on this website for personal or commercial use, subject to the condition that they are used lawfully. All files are the property of their respective owners.
The content on the website is provided AS IS for your information and personal use only. It may not be sold, licensed, or shared on other websites without obtaining consent from the author.
E N D
Presentation Transcript
DO in shallow habitats: initial data analysis and next steps and, time permitting, CY2013/FY2014 project updates David Senn and Emily Novick davids@sfei.org Image: C. Benton
Highest Priority Issues CM report Determine whether increasing biomass signals future impairment Characterize/quantify factors that adversely affect phytoplankton composition, including harmful algal blooms Determine if low DO in shallow habitats causes impairment Quantify role of nutrients Test future scenarios that may lead to worsening conditions Quantify nutrient contributions to different areas of the Bay Test mitigation/prevention scenarios
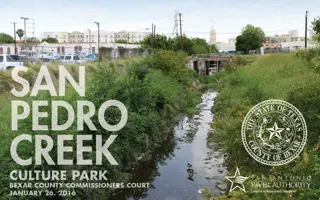
DO in Sloughs and Former Salt Ponds of LSB Key Questions Is low DO occurring? Worse than natural conditions? Frequency, duration, severity Limiting habitat for fish and benthos? Mechanisms ? Anthropogenic nutrients? Salt ponds?
Why do we care? Fish like O2, and some need more than others Species A DO Species D Species C T
Dissolved Oxygen (%sat) in Lower South Bay **Deep subtidal** 100 80 60 40 2010 1995 2005 2000 Pulse of the Bay (2013) Data: USGS
DO in Sloughs and Former Salt Ponds of LSB Approach Report #1 Data gathering, cleaning Basic data analysis <5mg L-1 <2.8 mg L-1 SFEI (Jabusch et al.) Report #2 Mechanistic analysis SFEI + USGS (Downing-Kunz, Senn )
Dissolved oxygen data in LSB and South Bay margins Continuous Discrete
DO in Sloughs and Former Salt Ponds (data = 2004-2012) %Time below 5 mg L-1 100 80 60 40 20 0 Former Salt Ponds n=14 Sloughs n=10 SFEI (2013)
Data Availability: color = frequency < 5 mg L-1 2004 2006 2008 2010 2012 Creeks/sloughs Ponds
exchange Major factors influencing DO organic matter (+) Photosynthesis [DO] tides, flows [DO] ( - ) respiration mid-day max Photosynthesis: Respiration: ~constant Tides: semi-diurnal, spring/neap
Alviso Slough: June 2012 April 2013 10 8 4 Data: M Downing-Kunz, USGS 0
Alviso Slough: June 2012 April 2013 10 8 4 Data: M Downing-Kunz, USGS 0
Tides vs. DO production vs. DO consumption.Who wins? Time of Day Jun 15 2012 Sep 14 2013 Date
Tides vs. DO production vs. DO consumption.Who wins? Time of Day Jun 15 2012 Sep 14 2013 Date Data: M Downing-Kunz, USGS Mean = 3.9 mg L-1
Depth Time of Day Jun 15 2012 Sep 14 2013 Data: M Downing-Kunz, USGS Data: M Downing-Kunz, USGS
DO with Depth Overlay Time of Day Jun 15 2012 Sep 14 2013 Date Data: M Downing-Kunz, USGS Mean = 3.9 mg L-1
DO with Depth Overlay Time of Day Jun 15 2012 Sep 14 2013 Date Data: M Downing-Kunz, USGS Mean = 3.9 mg L-1
Tides vs. production vs. consumption.Who wins? Time of Day Jun 15 2012 Apr 9 2013 Date Data: M Downing-Kunz, USGS
Data Availability: color = frequency < 5 mg L-1 2004 2006 2008 2010 2012 Creeks/sloughs Ponds


 in Lower South Bay")


")


![get⚡[PDF]❤ Building Habitats on the Moon: Engineering Approaches to Lunar Settle](/thumb/21624/get-pdf-building-habitats-on-the-moon-engineering-approaches-to-lunar-settle.jpg)