Semi-supervised Learning
Semi-supervised learning bridges the gap between the ease of collecting data and the expense of labeling it. By utilizing a combination of labeled and unlabeled data, this approach enhances model performance and efficiency. It leverages the distribution of unlabeled data with specific assumptions to improve learning outcomes. The convergence of algorithms in semi-supervised generative models is influenced by initialization, emphasizing the importance of precise model setup and iteration.
Download Presentation

Please find below an Image/Link to download the presentation.
The content on the website is provided AS IS for your information and personal use only. It may not be sold, licensed, or shared on other websites without obtaining consent from the author.If you encounter any issues during the download, it is possible that the publisher has removed the file from their server.
You are allowed to download the files provided on this website for personal or commercial use, subject to the condition that they are used lawfully. All files are the property of their respective owners.
The content on the website is provided AS IS for your information and personal use only. It may not be sold, licensed, or shared on other websites without obtaining consent from the author.
E N D
Presentation Transcript
Semi-supervised Learning
Introduction Labelled data cat dog Unlabeled data (Image of cats and dogs without labeling)
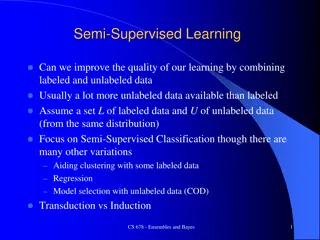
Introduction ? Supervised learning: ??, ?? E.g. ??: image, ??: class labels Semi-supervised learning: ??, ?? A set of unlabeled data, usually U >> R Transductive learning: unlabeled data is the testing data Inductive learning: unlabeled data is not the testing data Why semi-supervised learning? Collecting data is easy, but collecting labelled data is expensive We do semi-supervised learning in our lives ?=1 ?+? ? , ?? ?=1 ?=?
Why semi-supervised learning helps? Who knows? The distribution of the unlabeled data tell us something. Usually with some assumptions
Outline Semi-supervised Learning for Generative Model Low-density Separation Assumption Smoothness Assumption Better Representation
Semi-supervised Learning for Generative Model
Supervised Generative Model Given labelled training examples ?? ?1,?2 looking for most likely prior probability P(Ci) and class- dependent probability P(x|Ci) P(x|Ci) is a Gaussian parameterized by ?? and ?1, ?2, Decision Boundary With ? ?1, ? ?2,?1,?2, ? ?|?1? ?1 ? ?1|? = ? ?|?1? ?1 + ? ?|?2? ?2
Semi-supervised Generative Model Given labelled training examples ?? ?1,?2 looking for most likely prior probability P(Ci) and class- dependent probability P(x|Ci) P(x|Ci) is a Gaussian parameterized by ?? and ?1, ?2, Decision Boundary The unlabeled data ?? help re-estimate ? ?1, ? ?2, ?1,?2,
Semi-supervised Generative Model The algorithm converges eventually, but the initialization influences the results. Initialization:? = ? ?1,? ?2,?1,?2, Step 1: compute the posterior probability of unlabeled data E ???1|?? Depending on model ? Back to step 1 M Step 2: update model ?: total number of examples ?1: number of examples belonging to C1 ? ?1 =?1+ ??? ?1|?? ? 1 ?1 1 ?1= ??+ ? ?1|???? ??? ?1|?? ?? ?1 ??
Why? ? = ? ?1,? ?2,?1,?2, Maximum likelihood with labelled data ???????| ?? ???? ? = ??, ?? Maximum likelihood with labelled + unlabeled data ???????| ??+ ??????? ???? ? = ?? ??, ?? Solved iteratively ????= ????|?1? ?1 + ????|?2? ?2 (?? can come from either C1 and C2)
Semi-supervised Learning Low-density Separation Black-or-white
Self-training ? Given: labelled data set = ??, ?? = ?? ?=1 Repeat: Train model ? from labelled data set , unlabeled data set ?=1 ? You can use any model here. Regression? Apply ? to the unlabeled data set Obtain ??,?? Remove a set of data from unlabeled data set, and add them into the labeled data set How to choose the data set remains open ? Pseudo-label ?=1 You can also provide a weight to each data.
Self-training Similar to semi-supervised learning for generative model Hard label v.s. Soft label Considering using neural network ? (network parameter) from labelled data New target for ?? is 1 Hard Class 1 0 0.7 0.3 ?? ? It looks like class 1, then it is class 1. New target for ?? is 0.7 70% Class 1 30% Class 2 Soft 0.3 Doesn t work
Entropy-based Regularization Entropy of ??: Evaluate how concentrate the distribution ?? is ?? ?? ? Distribution 5 ? ??= 0 ? ??= ??? ?? ? ?? Good! ?? ?=1 1 2 3 4 5 As small as possible ? ??= 0 ?? Good! labelled data 1 2 3 4 5 ? ??, ?? ? = ? ?? ?? Bad! 1 5 ?? = ?? unlabeled data ? ?? +? 1 2 3 4 5 = ??5 ??
Outlook: Semi-supervised SVM Enumerate all possible labels for the unlabeled data Find a boundary that can provide the largest margin and least error Thorsten Joachims, Transductive Inference for Text Classification using Support Vector Machines , ICML, 1999
Semi-supervised Learning Smoothness Assumption You are known by the company you keep
Smoothness Assumption Assumption: similar ? has the same ? More precisely: x is not uniform. If ?1 and ?2 are close in a high density region, ?1 and ?2 are the same. connected by a high density path v.s. Source of image: http://hips.seas.harvard.edu/files /pinwheel.png v.s.
Smoothness Assumption Assumption: similar ? has the same ? More precisely: x is not uniform. If ?1 and ?2 are close in a high density region, ?1 and ?2 are the same. ?3 ?1 ?2 connected by a high density path ?1and ?2have the same label Source of image: http://hips.seas.harvard.edu/files /pinwheel.png ?2and ?3have different labels
Smoothness Assumption Not similar? similar? indirectly similar with stepping stones (The example is from the tutorial slides of Xiaojin Zhu.) Source of image: http://www.moehui.com/5833.html/5/
Smoothness Assumption Classify astronomy vs. travel articles (The example is from the tutorial slides of Xiaojin Zhu.)
Smoothness Assumption Classify astronomy vs. travel articles (The example is from the tutorial slides of Xiaojin Zhu.)
Cluster and then Label Cluster 2 Class 2 Class 1 Class 1 Class 2 Class 2 Cluster 1 Cluster 3 Using all the data to learn a classifier as usual
Graph-based Approach How to know ?1 and ?2 are connected by a high density path Represented the data points as a graph Graph representation is nature sometimes. E.g. Hyperlink of webpages, citation of papers Sometimes you have to construct the graph yourself.
The images are from the tutorial slides of Amarnag Subramanya and Partha Pratim Talukdar Graph-based Approach - Graph Construction Define the similarity ? ??,?? between ?? and ?? Add edge: K Nearest Neighbor e-Neighborhood Edge weight is proportional to s ??,?? Gaussian Radial Basis Function: 2 ? ??,??= ??? ? ?? ??
Graph-based Approach Class 1 Class 1 Class 1 Class 1 Class 1 x The labelled data influence their neighbors. Propagate through the graph
Graph-based Approach Define the smoothness of the labels on the graph ? =1 2 ?,? For all data (no matter labelled or not) ??,??? ??2 Smaller means smoother ?1= 0 ?1= 1 x1 x1 3 3 ?3= 1 2 ?3= 1 2 x3 1 x3 1 ?2= 1 x2 x2 ?2= 1 1 1 x4 x4 ? = 3 ? = 0.5 ?4= 0 ?4= 0
Graph-based Approach Define the smoothness of the labels on the graph ? =1 2 ?,? ??,??? ??2 = ???? y: (R+U)-dim vector ? ? = ?? ?? L: (R+U) x (R+U) matrix 0 0 5 0 0 0 0 1 0 2 3 0 2 0 1 0 3 1 0 1 0 0 1 0 5 0 0 0 0 3 0 0 Graph Laplacian ? = D = ? = ? ?
Graph-based Approach Define the smoothness of the labels on the graph ? =1 2 ?,? Depending on model parameters ??,??? ??2 = ???? ? ??, ?? +?? ? = ?? smooth As a regularization term J. Weston, F. Ratle, and R. Collobert, Deep learning via semi-supervised embedding, ICML, 2008 smooth smooth
Semi-supervised Learning Better Representation
Looking for Better Representation Find a better (simpler) representations from the unlabeled data Original representation Better representation (In unsupervised learning part)
Reference http://olivier.chapelle.cc/ssl-book/
