Science Project - Investigating the Effects of Variables on Plant Growth
Conducting a science project to explore the impact of different variables on plant growth. The project involves formulating a hypothesis, conducting background research, testing the hypothesis, and analyzing the results to draw conclusions. Detailed information on the research process, hypothesis formulation, materials used, and more will be presented in the slide deck.
Download Presentation

Please find below an Image/Link to download the presentation.
The content on the website is provided AS IS for your information and personal use only. It may not be sold, licensed, or shared on other websites without obtaining consent from the author.If you encounter any issues during the download, it is possible that the publisher has removed the file from their server.
You are allowed to download the files provided on this website for personal or commercial use, subject to the condition that they are used lawfully. All files are the property of their respective owners.
The content on the website is provided AS IS for your information and personal use only. It may not be sold, licensed, or shared on other websites without obtaining consent from the author.
E N D
Presentation Transcript
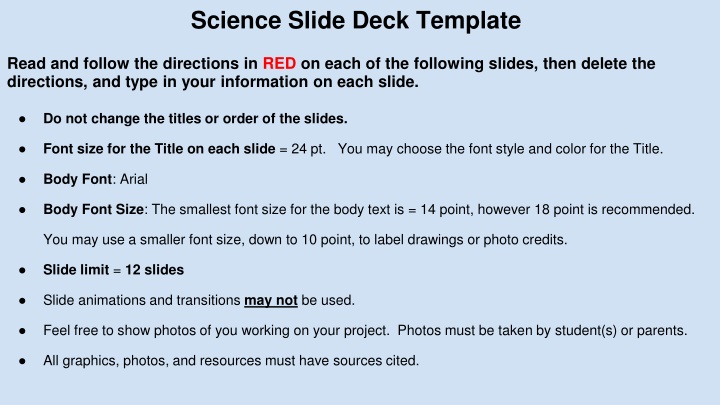
Science Slide Deck Template Read and follow the directions in RED on each of the following slides, then delete the directions, and type in your information on each slide. Do not change the titles or order of the slides. Font size for the Title on each slide = 24 pt. You may choose the font style and color for the Title. Body Font: Arial Body Font Size: The smallest font size for the body text is = 14 point, however 18 point is recommended. You may use a smaller font size, down to 10 point, to label drawings or photo credits. Slide limit = 12 slides Slide animations and transitions may not be used. Feel free to show photos of you working on your project. Photos must be taken by student(s) or parents. All graphics, photos, and resources must have sources cited.
Title (Type creative project title here) Question: (The Question you are going to ask and answer) . Examples: What are the effects of ______(Independent Variable) _____on _______(Dependent Variable)___________? How does ____(Independent Variable)________affect ___________(Dependent Variable)_______________________? Name: School: Teacher:
Abstract Write the Abstract last, after all your results and analysis are finished. The Abstract is a summary of your project, (250 words or less) and must include: Problem Procedures Data and brief analysis (no graphs) Conclusion (the answer to your question based on your data and with an accurate scientific explanation).
Background Research Brief summary of the background research- print, digital, and interviews used to answer your question. Provide citations for the all the resources used throughout the project.
Hypothesis Your educated answer to your question, after you have done your background research, that you are going to test. Examples: I think that _____(state your Hypothesis)_____ because ___________(state the reason why you think your Hypothesis is the answer). An If then statement will include both the Independent variable and the Dependent variable. If _______(Independent variable), then ______(Dependent Variable)______________. If plants are watered with a 10% a soap solution, then their growth will be negatively affected . (Independent Variable) (Dependent Variable) If you increase the amount of electrical current, then a motor will turn faster. (Independent Variable) (Dependent Variable)
Materials Provide a detailed list of all the items you used to complete your project. (be specific: size, number, amount. etc.)
Procedures List and number all the steps/procedures you followed to complete your project. The Procedures should be specifically written so others may replicate your exact steps. Provide specific information: size, shape, quantities, materials, experimental set-up, etc..
Results - Data/Observations Include any qualitative and quantitative data collected while testing your Hypothesis. Include charts and graphs of your results. Use appropriate statistics (average, % error, and a variety of statistical tests) to analyze and share your results.
Results - Data/Observations (Continued) Include any qualitative and quantitative data collected while testing your Hypothesis. Include charts and graphs of your results. Use appropriate statistics (average, % error, and a variety of statistical tests) to analyze and share your results.
Discussion Summarize and Analyze your data including patterns, trends, errors and variables that could have influenced the results. If data was collected, use appropriate statistics (average, % error, and a variety of statistical tests) to analyze and share your results. Were you able to scientifically explain why you got the results that you did? If available, relate your findings to other studies or questions that are related to your project. What applications do you see for the answer to your question? Did your project turn out as you expected? Any Next steps? Further research questions? Ideas?
Conclusion What was the answer to your Question? Was your Hypothesis correct? Did your data verify or not verify your Hypothesis and answer your Question? Were you able to scientifically explain why you got the results that you did? What application(s), if any, do you see for your work? Do you have any further research questions or other variables to test as a result of this project? Any Next steps? Further research questions? Ideas?
Reflection/Application Things you might want to reflect on: How your Background Research helped you formulate your Hypothesis and design a way to test it. What you learned from doing this project? What you might have done differently? How your results may be applied to everyday life? Who would be interested in knowing about the results of your project? How your results may be applied to other similar questions or studies. What next steps or future questions might you investigate?
References Cited 1. List all citations and resources, both print and electronic, including personal interviews, in alphabetical order using the APA Citation Guide: See examples at: https://www.mendeley.com/guides/apa-citation-guide 2. Citation Requirements: - Jr. Projects = Minimum 3 references - Sr. Projects = Minimum 5 references
