San Francisco Food & Beverage Industry Cluster Analysis
Explore the significance of the Food & Beverage Industry Cluster in San Francisco's economy, including its impact on employment, socio-economic diversity, and innovation. The region's trends, challenges, and opportunities in food manufacturing, beverage manufacturing, and wholesaling are examined, highlighting San Francisco's role in the broader Bay Area landscape. Learn about the employment growth and shifts within the industry over the years.
Download Presentation

Please find below an Image/Link to download the presentation.
The content on the website is provided AS IS for your information and personal use only. It may not be sold, licensed, or shared on other websites without obtaining consent from the author.If you encounter any issues during the download, it is possible that the publisher has removed the file from their server.
You are allowed to download the files provided on this website for personal or commercial use, subject to the condition that they are used lawfully. All files are the property of their respective owners.
The content on the website is provided AS IS for your information and personal use only. It may not be sold, licensed, or shared on other websites without obtaining consent from the author.
E N D
Presentation Transcript
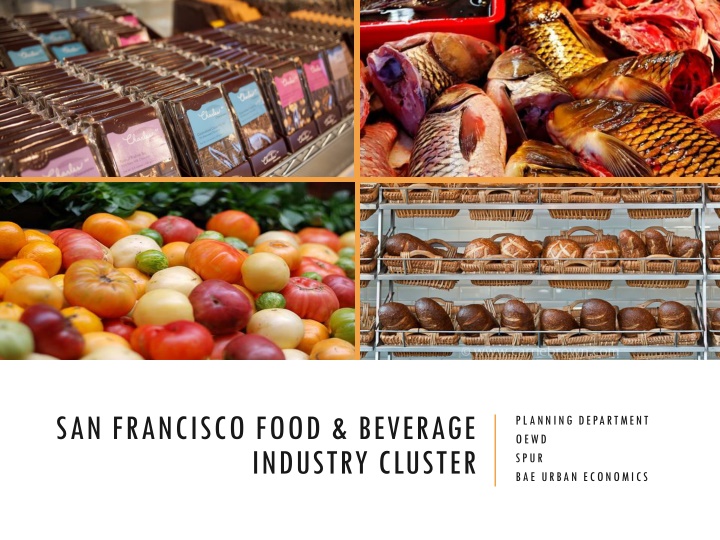
SAN FRANCISCO FOOD & BEVERAGE INDUSTRY CLUSTER PLANNING DEPARTMENT OEWD SPUR BAE URBAN ECONOMICS
INTRODUCTION What is the Food & Beverage Industry Cluster? Food Manufacturing Bakeries, Chocolate & Confections, Seafood Processing, etc Beverage Manufacturing Breweries, Wineries, Distilleries Food & Beverage Wholesalers Grocery, Alcoholic Beverage, Farm Products & Supplies Wholesalers Why is this important to San Francisco economy? Supports Employment and Socio-Economic Diversity Blue-collar jobs create opportunity for all educational backgrounds Cluster Effects Positively reinforcing loops can accelerate growth and innovation The San Francisco Brand Unique, creative businesses attract diverse residents and support the tourism, hospitality, and other
REGIONAL TRENDS Manufacturing/Wholesale vs. Total Economy 2012 Manufacturing and wholesaling make up a small part of the regional and San Francisco economies... Bay Area 13% 87% 4% San Francisco 96% Manufacturing & Wholesale Jobs All Other Jobs Food/Bev. vs. Other Mfg/Wholesale 2012 but Food & Beverage jobs make up an important part of those sectors, especially in San Francisco. Bay Area 16% 84% San Francisco 24% 76% Food & Bev.Mfg/Wholesale Jobs Other Mfg & Wholesale Jobs Sources: Bureau of Labor Statistics, Quarterly Census of Employment and Wages (QCEW), 2012; BAE, 2014
REGIONAL TRENDS San Francisco plays a small role in the region s food and beverage manufacturing. Alameda, Napa, and Sonoma Counties are major players. Food Manufacturing 1,853 22,930 211 Beverage Manufacturing 18,085 Food & Bev. Wholesalers 23,308 2,986 0 5,000 10,000 15,000 20,000 25,000 Number of Employees San Francisco Alameda Contra Costa Marin Napa San Mateo Santa Clara Solano Sonoma Sources: Bureau of Labor Statistics, Quarterly Census of Employment and Wages (QCEW), 2012; BAE, 2014 . *As per QCEW disclosure policy, employment data for Beverage Manufacturing and Alcoholic Beverage Wholesalers in Solano County and for Farm Product Raw Materials Wholesalers in multiple counties are not publicly disclosed.
REGIONAL TRENDS In the Bay Area, San Francisco had the largest loss in food manufacturing jobs Food Manufacturing Employment Growth 1990 - 2012 12,000 10,000 Alameda 8,000 6,000 4,000 Santa Clara Sonoma San Mateo 2,000 San Francisco Solano Contra Costa Napa Marin 0 1990 1992 1994 1996 1998 2000 2002 2004 2006 2008 2010 2012 Sources: Bureau of Labor Statistics, Quarterly Census of Employment and Wages (QCEW), 2012; BAE, 2014.
SAN FRANCISCO TRENDS Since 1990, food manufacturing has accounted for most of the loss in cluster jobs In recent years, however, wholesaling and manufacturing have both grown again San Francisco Food & Beverage Cluster Employment Trends 1990 - 2012 10,000 3,604 9,000 2,912 2,799 8,000 2,597 2,738 2,693 2,764 7,000 453 2,904 625 454 2,876 2,856 6,000 2,830 502 504 801 2,541 634 5,000 2,728 2,746 2,644 2,579 3,046 2,986 2,933 2,980 2,996 439 447 2,803 2,421 4,000 551 537 272 208 259 190 3,000 218 211 276 238 241 220 211 204 2,000 5,595 5,584 5,909 4,996 4,640 4,246 4,448 3,642 3,341 3,044 2,856 2,753 2,399 2,323 2,275 1,776 1,726 1,770 1,697 1,659 1,656 1,853 2,352 1,000 - Food Manufacturing Beverage Manufacturing Food & Bev. Wholesalers Sources: Bureau of Labor Statistics, Quarterly Census of Employment and Wages (QCEW), 2012; BAE, 2014.
SAN FRANCISCO TRENDS Food and Beverage Jobs in San Francisco, 1990 - 2010 Food and beverage manufacturing jobs have declined in San Francisco since 1990 1990 32,209 6,966 6,220 2000 42,941 8,465 3,393 even as jobs in restaurants, bars, grocery stores, and liquor stores grew 2010 47,472 8,726 1,863 0 10,000 20,000 30,000 40,000 50,000 60,000 Food Services and Drinking Places Food and Beverage Stores Food and Beverage Manufacturing Sources: Bureau of Labor Statistics, Quarterly Census of Employment and Wages (QCEW), 2012; BAE, 2014.
SAN FRANCISCO TODAY San Francisco Employment by Sector 2012 Number of Employees 0 500 1,000 1,500 2,000 2,500 3,000 Animal Processing 214 Seafood 98 Sugar & Conf. 95 Fruit & Veg. 46 Bakeries and Tortilla Man. 1,054 Other 317 Food Manufacturing (1,853) Dairy Products 29 Breweries & Distilleries 113 Beverage Manufacturing Wineries 67 (211) Soft Drink & Ice 31 Grocery & Related Products 2,075 Alcoholic Beverages 866 Food & Bev. Wholesalers (2,986) Farm Supplies 43 Sources: Bureau of Labor Statistics, Quarterly Census of Employment and Wages (QCEW), 2012; BAE, 2014.
SAN FRANCISCO TODAY San Francisco Food Manufacturing Revenue 2012 Bakeries have highest revenue in total, but also large number of small establishments (not shown) Bakeries & Torillas $107,973,000 Beverage $34,552,000 Animal Slaughtering $34,310,000 Seafood $32,020,000 Coffee & Tea and Candy manufacturing are small subsectors in terms of revenues Fruit & Veg. $10,650,000 Coffee & Tea $6,920,000 Sugar & Confectionery $5,990,000 Sources: Dun & Bradstreet, 2013; BAE, 2014.
BUSINESS SURVEYS: KEY CHALLENGES Transportation/access and workforce issues are bigger challenges for wholesalers than for manufacturers Real estate and capital access are the top challenges for manufacturers Wholesalers/Distributors (12 respondents) Food & Bev. Manufacturers (47 respondents) Labor costs 23% Real Estate 27% Transportation/Access 19% Capital access 21% Real Estate 16% Regulatory issues 12% Skilled workforce 16% Transportation/Access 11% Regulatory issues 13% Labor costs 9% Capital access 10% Skilled workforce 8% % responses (multiple selections) % responses (multiple selections) Sources: SFMade, 2014; SF Planning, 2014; BAE, 2014.
BUSINESS SURVEYS: LOCATION DECISIONS Top reasons for San Francisco location? Near customers and brand of San Francisco Wholesalers/Distributors (12 respondents) Food & Bev. Manufacturers (47 respondents) Near customers Near customers 20% 35% Brand association 19% Brand association 15% Near home 18% Near suppliers 15% Industry community 10% Found ideal space 12% Transportation 6% Near employees 12% Support services 6% Near home 8% Found ideal space 5% % responses (multiple selections) % responses (multiple selections) Sources: SFMade, 2014; SF Planning, 2014; BAE, 2014.
BUSINESS SURVEYS: SPACE & EXPANSION Most manufacturers operate in their own space or a commercial kitchen More than half of manufacturers will need new or expanded space within one year Current Production Space (Manufacturers only) Need for New or Expanded Space (Manufacturers Only) In the next few months Own space 43% 14% In the next year 43% Commercial kitchen 26% After more than one year 21% Shared space 19% Not in the immediate future 21% Copacker 13% % responses Sources: SFMade, 2014; SF Planning, 2014; BAE, 2014.
KEY FINDINGS San Francisco s Food and Beverage Cluster: Has relatively small share of Bay Area Food Cluster employment Accounts of of all City s manufacturing/wholesaling jobs Has seen a steep decline in employment since 1990, but appears to be leveling off since 2006 Has more jobs in wholesaling than manufacturing (with grocery wholesalers as largest) Bakeries is largest type of food manufacturer Top challenges facing Cluster in San Francisco: Real Estate (Affordable/Available Space + Build-Out Costs) Access to Capital Labor Costs Regulatory Issues Skilled workforce Mobility (Transportation + Distribution Access)
FOOD & BEVERAGE CLUSTER MAP Sources: BAE, 2014.
KEY DISCUSSION QUESTIONS Did we get it right on the challenges facing this cluster? Affordable space Access to capital Transportation issues Workforce issues Regulatory issues How can San Francisco help existing food and beverage manufacturers and wholesalers to stay and grow? What facilities, infrastructure, or services are missing today that, if located in San Francisco, would help existing businesses and attract new ones?
THANK YOU FOR YOUR PARTICIPATION! Next Steps Steering Committee Meeting Draft Report Steering Committee Meeting Final Report Final Steering Committee Meeting February 26th March 17th March 26th April 21st Date TBD Contacts Diana Sokolove Food System Policy Manager San Francisco Planning Department (415) 575-9046 diana.sokolove@sfgov.org Eli Zigas Food Systems and Urban Agriculture Program Manager SPUR (415) 644-4881 eli.zigas@spur.org Tiffany Garcia Business Development Manager Office of Economic and Workforce Development (415) 581-2322 tiffany.garcia@sfgov.org
