San Francisco Business Tax Revenue Forecast Update Fall 2023
San Francisco is facing a significant loss in business tax revenue compared to budget projections, with estimates ranging from $40M to $55M in annual losses for current and future fiscal years. The Homelessness Gross Receipts Tax (HGR) is a key source of revenue, but its revenue has been volatile and unpredictable due to factors like concentrated taxpayer basis and active business tax litigation. The forecast for FY24 through FY28 anticipates slow growth in the tax base and ongoing litigation risks impacting revenue. Policy-makers will need to revise their budget plans in light of these projections.
Download Presentation

Please find below an Image/Link to download the presentation.
The content on the website is provided AS IS for your information and personal use only. It may not be sold, licensed, or shared on other websites without obtaining consent from the author.If you encounter any issues during the download, it is possible that the publisher has removed the file from their server.
You are allowed to download the files provided on this website for personal or commercial use, subject to the condition that they are used lawfully. All files are the property of their respective owners.
The content on the website is provided AS IS for your information and personal use only. It may not be sold, licensed, or shared on other websites without obtaining consent from the author.
E N D
Presentation Transcript
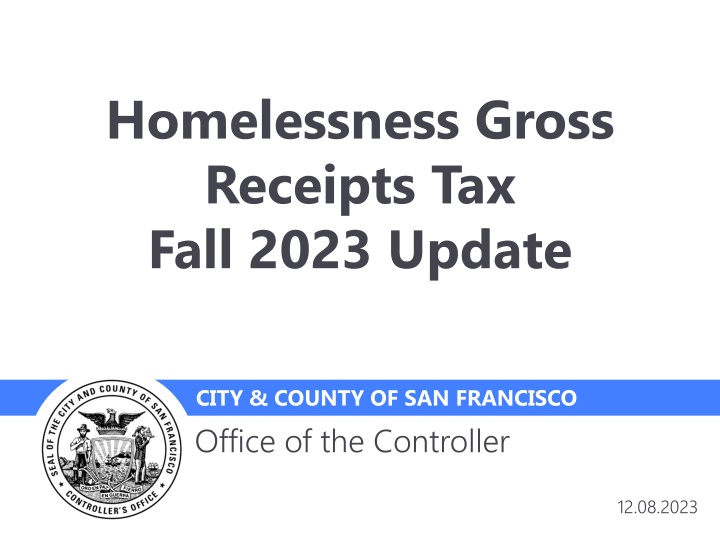
Homelessness Gross Receipts Tax Fall 2023 Update CITY & COUNTY OF SAN FRANCISCO Office of the Controller 12.08.2023
2 Overview San Francisco business taxes are volatile San Francisco business taxes are volatile, and budgets are based on forecasts at a moment in time. We update those projections throughout the year to help policy-makers manage budgets to a changing reality. We re projecting a significant loss in business tax revenue versus budgeted We re projecting a significant loss in business tax revenue versus budgeted levels, in both the current and future fiscal years levels, in both the current and future fiscal years. Our November forecast projects approximately $40M up to $55M in annual losses in the current and future fiscal years from the prior projection. This revision is in addition to the downward revision of a similar magnitude made in the prior years. Some downside risk remains. Some downside risk remains. While the forecast assumes little or no growth in the City s underlying tax base, it is not a recession scenario. Current and Current and future year plans may need to be revised. uture year plans may need to be revised. We will have another forecast in Spring 2024, in time for the annual budget cycle.
3 Basics of Homelessness Gross Receipts Tax (HGR) November 2018 Proposition C imposed a tax on gross receipts in excess of $50M, in addition to the existing gross receipts business tax. (i.e., if a business earned $150M, it pays taxes on $100M) Rate: HGR tax rates differ by industry Business Activity 1 Retail Trade, Wholesale Trade and Certain Services Tax Rate 0.175% 2 Manufacturing, Transportation & Warehousing, Information, Biotechnology, Clean Technology, and Food Services 0.500% 3 Accomodations, Utilities, Arts, Entertainment and Recreation 0.425% 4 Private Education and Health Services, Administrative and Support Services, and Miscellaneous Business Activities 0.690% 5 Construction 0.475% 6 Financial Services, Insurance, and Professional, Scientific and Technical Services 0.600% 7 Real estate and Rental and Leasing Services 0.325% Base: Homelessness gross receipts tax (HGR) payors include the largest payors of the existing gross receipts (GR) tax. In tax year 2022, there were 358 payors of HGR versus 10,492 payors of GR.
4 Volatile and Unpredictable Revenue Source HGR Tax revenue came in significantly below budget in the last 2 years (by $57M in FY22 and $65M in FY23). These variances are primarily due to (1) the taxpayer basis being highly concentrated so changes at a few large firms have an outsized effect on revenue (2) high levels of active business tax litigation that can affect prior year payments. 247.5 247.5
5 FY 24 through FY 28 Preliminary Forecast Homelessness Gross Receipts Tax Forecast Homelessness Gross Receipts Tax Forecast (in $ million) Based on the volume of recent tax refund claims, the forecast was lowered from our previous assumption. Budget Budget / / Prior Prior Proj. Proj. Current Current Proj. Proj. Key assumptions: Slow or no growth of tax base in earlier years of forecast to reflect slowing of the economy, and back to inflation in future years. Current levels of remote work continue. Lower tax base to reflect ongoing litigation risk. Year Year FY21-22 FY21-22 FY22-23 FY22-23 FY23-24 FY23-24 FY24-25 FY24-25 FY25-26 FY25-26 FY26-27 FY26-27 FY27-28 FY27-28 Actuals Actuals 278.6 278.6 247.9 247.9 Change Change 293.5 293.5 297.6 297.6 305.7 323.5 329.1 255.1 253.8 253.6 269.0 274.7 (38.4) (43.8) (52.1) (54.5) (54.4)
6 Next Steps January 2024, Controller, Mayor s Office and Board of Supervisors issue the Five-Year Financial Plan February 2024, Controller s Six-Month Budget Update for FY 2023-24 March 2024, Controller, Mayor s Office and Board of Supervisors issue an update to the Five-Year Financial Plan May 2024, Controller s Nine-Month Budget Update for FY 2023-24
7 Closing Current year forecast. Current year forecast. As in the last two fiscal years, departments will need to ensure expenditure budgets align with forecasted revenue amounts in FY 2023-24. Spending plans in the upcoming budget years will need to be revisited. Spending plans in the upcoming budget years will need to be revisited. The Controller s Office will update our future fiscal year forecasts in February and March of 2024 with the most recent information. There s significant risk to this forecast. There s significant risk to this forecast.



![Town of [Town Name] Real Estate Tax Rates and FY 2024 Budget Summary](/thumb/62211/town-of-town-name-real-estate-tax-rates-and-fy-2024-budget-summary.jpg)


