Sampling Adequacy
1
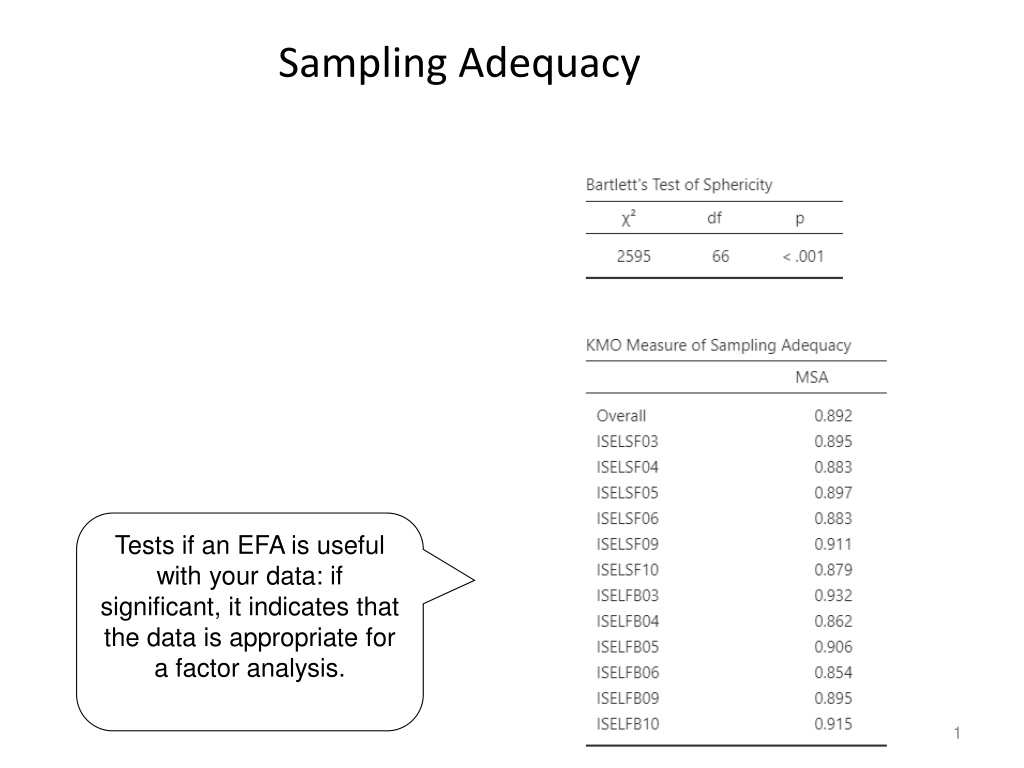
Sampling Adequacy
Tests if an EFA is useful
with your data: if
significant, it indicates that
the data is appropriate for
a factor analysis.
Communalities
•
Indicate the proportion of common variance in an
item
•
Sum of squared factor loadings for that variable (e.g.,
item) across all the factors
•
Keeps track of how much of the original variance that
was contained in a particular variable is still
accounted for by all retained factors
2
Communalities
3
Number of factors
Determining the number of factors can be done
by two methods:
•
Scree plot (visual examination)
•
Kaiser’s rule (eigenvalue of greater than 1)
4
5
Scree Plot
Eigenvalue
•
The number of factors with an eigenvalue of
greater than 1 is two, which explains 58.0% of
the variance of the data.
6
This content covers Sampling Adequacy Tests to determine if factor analysis is suitable for your data, communalities to assess common variance in items, methods for determining the number of factors, and factors' eigenvalue explaining variance. The visuals provided include Sampling Adequacy, Communalities, Number of Factors, Scree Plot, and Eigenvalue.

Uploaded on Feb 16, 2025 | 0 Views
Download Presentation

Please find below an Image/Link to download the presentation.
The content on the website is provided AS IS for your information and personal use only. It may not be sold, licensed, or shared on other websites without obtaining consent from the author.If you encounter any issues during the download, it is possible that the publisher has removed the file from their server.
You are allowed to download the files provided on this website for personal or commercial use, subject to the condition that they are used lawfully. All files are the property of their respective owners.
The content on the website is provided AS IS for your information and personal use only. It may not be sold, licensed, or shared on other websites without obtaining consent from the author.
E N D
Presentation Transcript
Sampling Adequacy Tests if an EFA is useful with your data: if significant, it indicates that the data is appropriate for a factor analysis. 1
Communalities Indicate the proportion of common variance in an item Sum of squared factor loadings for that variable (e.g., item) across all the factors Keeps track of how much of the original variance that was contained in a particular variable is still accounted for by all retained factors 2
Number of factors Determining the number of factors can be done by two methods: Scree plot (visual examination) Kaiser s rule (eigenvalue of greater than 1) 4
Eigenvalue The number of factors with an eigenvalue of greater than 1 is two, which explains 58.0% of the variance of the data. 6