Risk Assessment and Ventilation Modeling for Hydrogen Vehicle Repair Garages
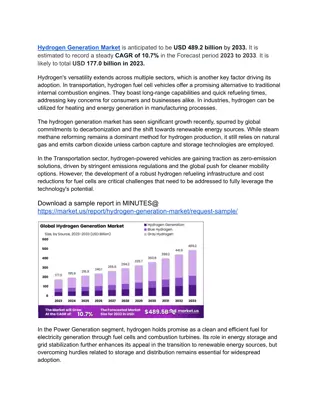
This paper discusses the demand for additional maintenance facilities in hydrogen vehicle repair garages due to the increased use of hydrogen fuel cell electric vehicles. It highlights the need for ventilation and upgrades in existing facilities to handle hydrogen releases during maintenance. The objective is to conduct risk analyses and detailed modeling to identify potential hazard scenarios, inform code requirements, and improve safety standards. The approach involves application-specific risk assessment, computational fluid dynamics modeling, and code recommendations based on key scenarios. The study also covers HAZOP risk analysis, scenario ranking by severity and frequency, and descriptions of major, moderate, and minor hydrogen release scenarios.

Download Presentation

Please find below an Image/Link to download the presentation.
The content on the website is provided AS IS for your information and personal use only. It may not be sold, licensed, or shared on other websites without obtaining consent from the author.If you encounter any issues during the download, it is possible that the publisher has removed the file from their server.
You are allowed to download the files provided on this website for personal or commercial use, subject to the condition that they are used lawfully. All files are the property of their respective owners.
The content on the website is provided AS IS for your information and personal use only. It may not be sold, licensed, or shared on other websites without obtaining consent from the author.
E N D
Presentation Transcript
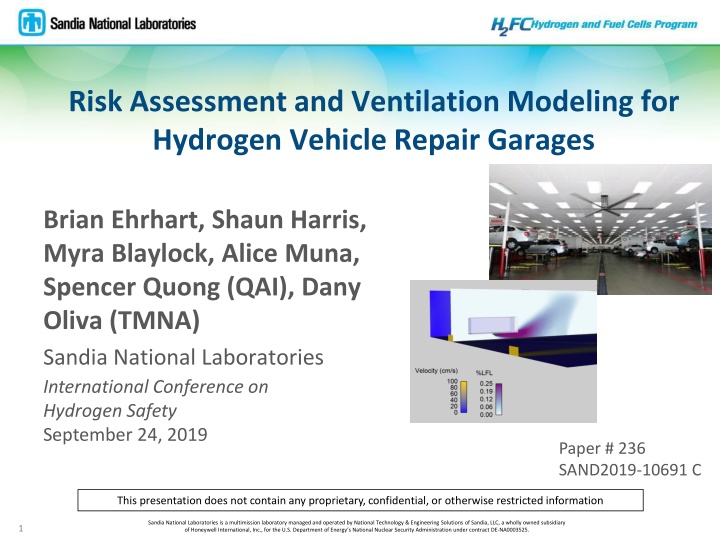
Risk Assessment and Ventilation Modeling for Hydrogen Vehicle Repair Garages Brian Ehrhart, Shaun Harris, Myra Blaylock, Alice Muna, Spencer Quong (QAI), Dany Oliva (TMNA) Sandia National Laboratories International Conference on Hydrogen Safety September 24, 2019 Paper # 236 SAND2019-10691 C This presentation does not contain any proprietary, confidential, or otherwise restricted information Sandia National Laboratories is a multimission laboratory managed and operated by National Technology & Engineering Solutions of Sandia, LLC, a wholly owned subsidiary of Honeywell International, Inc., for the U.S. Department of Energy s National Nuclear Security Administration under contract DE-NA0003525. 1
H2 Vehicle Repair Garage Infrastructure Demand for additional maintenance facilities grows with increased hydrogen fuel cell electric vehicle (FCEV) use Purpose-built, new infrastructure is expensive Ventilation and other upgrades required for existing facilities Cost can be very high for large, multi-bay repair facilities Objective: Perform application-specific risk analyses to identify credible hazard scenarios resulting in unintentional indoor releases of hydrogen during vehicle maintenance operations, characterize key hydrogen release scenarios through detailed modeling, and improve code requirements. 2
Approach: Risk Analysis and Modeling to Inform Code Requirements Risk Analysis Repair garage application-specific risk assessment and credible scenario identification Modeling Computational fluid dynamics (CFD) modeling for indoor hydrogen releases Based on key scenarios from risk assessment Code Recommendations Results of risk analyses and modeling will be incorporated into proposals to improve requirements for repair garages while maintaining same level of safety 3 Identify relevant maintenance activities Identify potential issues Apply risk value Select part
HAZOP Risk Analysis Hazard and Operability Study (HAZOP) Develop framework with input from QAI and industry for H2 FCV scenarios Scenarios ranked by severity of consequence and frequency of occurrence 490 unique scenarios identified 18 of these had potential hydrogen release Others eliminated due to equivalent or lesser concern Severity Value 3 2 1 Description Major: Release of full inventory of hydrogen Moderate: 1 tank of hydrogen (half of full inventory) Minor: Small release of hydrogen Frequency Value 5 4 3 2 1 Description Intentional Anticipated Unlikely Extremely unlikely Beyond extremely unlikely Frequency f > 10-2/year 10-4/yr < f < 10-2/yr 10-6/yr < f < 10-4/yr f < 10-6/yr 4
HAZOP Scenarios: 4 Medium-Risk, No High-Risk Consequence (Release) 2 tanks, high pressure, jet fire (worst consequence) Scenario Event Description Comments Only occurs when external fire heats H2 storage Mitigated by detection; the event below bounds this scenario Focus of modeling due to higher risk score (combination of likelihood and consequence) Low probability of occurring External fire causes TPRD release of H2 cylinders A Small release in low- pressure system <1 tank, low pressure (most likely) B Premature disconnect of venting tool 1 or 2 tanks, low pressure C Premature disconnect of high pressure defueling tool 1 tank, high pressure D 5
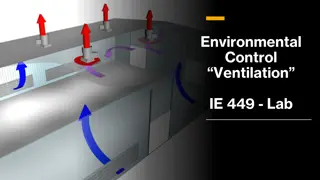
CFD Modeling Domain Event: Vent hose severed while vehicle defueling to an external exhaust outlet Typical 12-bay garage Each bay 14 x 27 x 16 Center aisle 6 x 84 x 16 Leak: 2.5 kg of H2 released Most hydrogen vehicles have 2 tanks which store approximately 2.5 kg of hydrogen each Release from mid-pressure port: 1.5 MPa (217.6 psi) Downward release from vehicle underside 6
Modeling Scenarios Analyzed Facility ventilation varied between cases No ventilation Regular ventilation (1 cfm/ft2) near the vehicle Regular ventilation (1 cfm/ft2) away from the vehicle Higher ventilation (300 cm/s) directed at the vehicle Computer modeling simulates the leak and shows: Direction of ventilation and released gas Any areas of flammable mixture (Lower Flammability Limit (LFL) = 4 mol%) Total flammable mass is critical safety metric considered 7
Hydrogen Leak Velocity CFD simulations rely on low-velocity gas flow Flammable concentration does not reach floor for low-pressure release May need to model differently for high-pressure releases in the future 8
No Ventilation Leak comes from center of bottom of vehicle Vehicle Flammable Area (2 g total flammable H2) Fraction of LFL Blue walls and floor are 0 cm/s velocity Showing no air movement for no- ventilation scenario Flammable area has color- scale based on concentration Maximum flammable mass scenario 9
Ventilation Near Leak Vent Outlets Vehicle Vent Air Inlet (4 inlets, 1 cfm/ft2) Flammable Area (0.4 g total flammable H2) Smaller than no-ventilation scenario Fraction of LFL Flammable area has color- scale based on concentration Yellow on walls and floor means 100 cm/s velocity Showing air movement from ventilation Ventilation directed at leak area leads to a decrease in maximum flammable mass 10
Ventilation Near Leak (Again) Showing Dissipation Side view of leak scenario Hydrogen mixes with air (diluting) and going towards ceiling vent outlets Vent Air Inlet (4 inlets, 1 cfm/ft2) Vehicle Green is flammable area near leak point Fraction of LFL Purple is hydrogen concentration below LFL 11
Ventilation Away From Vehicle Vent Outlets Vent Air Inlet (4 inlets, 1 cfm/ft2) Vehicle Flammable Area (2 g total flammable H2) Similar to no-ventilation case Fraction of LFL Yellow on walls and floor mean 100 cm/s velocity Showing air movement from ventilation Ventilation away from the vehicle has little affect on maximum flammable mass 12
Higher Ventilation Directed at Vehicle Vent Outlets Vent Air Inlet (1 inlet higher velocity Total: 1 cfm/ft2) Vehicle Flammable Area (0.06 g total flammable H2) Smaller than ventilation- near-leak and no- ventilation scenarios Fraction of LFL Dark yellow shows 300 cm/s velocity. Showing air movement from ventilation Higher ventilation directed at the leak area leads to the largest decrease of flammable mass 13
Hazard Quantification Flammable mass Total flammable mass of hydrogen in garage based on wherever the local hydrogen concentration is >LFL (>4 mol%) Maximum Flammable Mass (g) 2 Ventilation No-ventilation case has low amount of flammable mass relative to mass released (<0.1% of 2.5 kg) Dispersion of hydrogen in large area Slow (low pressure) release No Ventilation Standard ventilation near leak Standard ventilation away from leak Higher velocity ventilation near leak 0.4 2 Ventilation directed at leak area leads to a 80% to 97% decrease in maximum flammable mass 0.06 1,000 g of hydrogen 1 gallon of gasoline Ventilation not directed at leak has little effect on maximum flammable mass 14
Conclusions Code-compliant ventilation might not reduce flammable mass compared to no-ventilation case Flammable mass small relative to amount released for low-pressure leak Ventilation directed at leak reduced flammable mass by an order-of- magnitude Higher velocity, directed ventilation further reduces flammable mass Might provide a way to increase safety without changes to entire facility 15
Remaining Challenges Risk analysis and modeling performed for large repair garage Other structures (parking, small garages) could have different hazards and geometries Effect of spreading or obstructions Current CFD modeling jet unaffected by wall, floor, equipment, etc. Further incorporation of results into safety codes and standards Results and recommendations need to be translated into improved code requirements that maintain same level of safety 16
Thank you! QUESTIONS? 17


 – Showing Dissipation")