Reaction Path Traces in GWB12
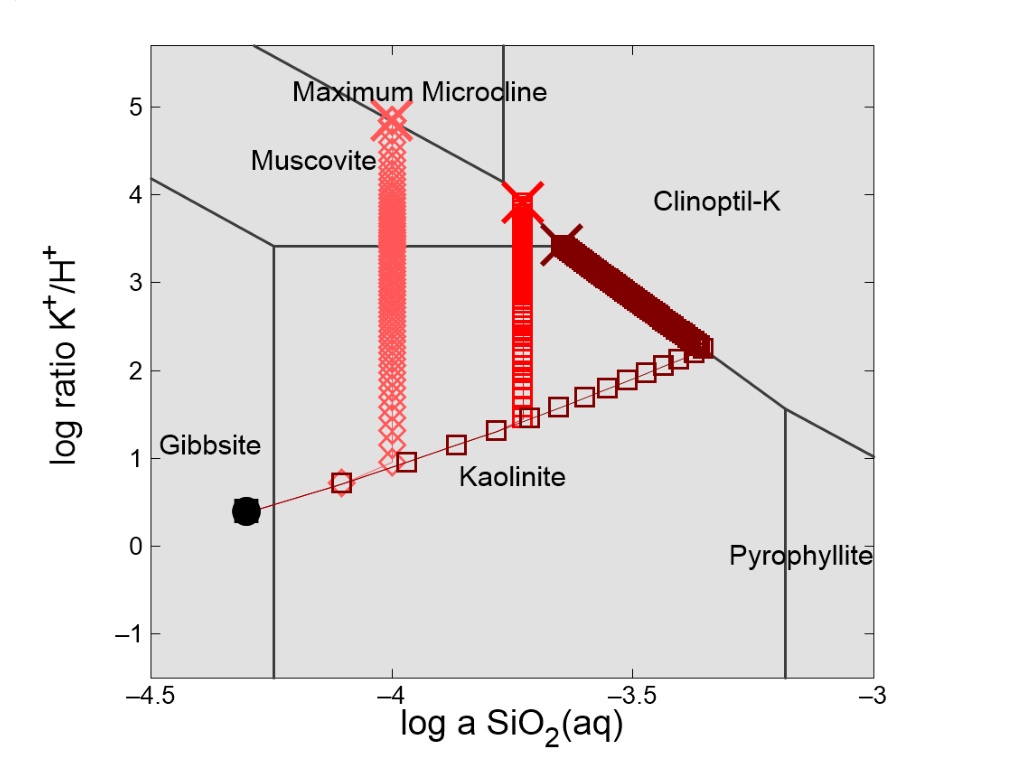
In the model, K-feldspar is
titrated into an acidic fluid.
The trace of a reaction path calculated in
React
can be overlain on
Act2
or
Tact
diagrams.
The working directory, where
calculation results will be saved.
React
runs and generates text
format (React_output.txt) and plot
format (React_plot.gtp) output files
in the specified working directory.
Create an
Act2
or
Tact
diagram,
then
left-drag
the .gtp file onto it…
…or, go to
File → Open → Reaction
Trace…
and browse to the .gtp file.
Start of simulation
Check to show markers.
Each represents an addition
of K-feldspar to the system.
End of simulation
Reaction trace shows how mineral stability and fluid
chemistry evolve as K-feldspar dissolves into the system.
In GWB12, you can overlay multiple
reaction traces on
Act2
or
Tact
diagrams.
Click ‘add’ and select the
desired .gtp files from
React
simulations.
Customize markers and lines
for each reaction trace.
Each assumes a different
silica polymorph forms,
which affects stable
mineral assemblages.
Visualizing reaction path traces in GWB12 using Act2 or Tact diagrams helps in analyzing how mineral stability and fluid chemistry evolve during reactions like K-feldspar titration. By overlaying multiple traces, customizing markers and lines, users can explore the impact of different silica polymorph forms on stable mineral assemblages, enhancing their understanding of complex systems.

Download Presentation

Please find below an Image/Link to download the presentation.
The content on the website is provided AS IS for your information and personal use only. It may not be sold, licensed, or shared on other websites without obtaining consent from the author.If you encounter any issues during the download, it is possible that the publisher has removed the file from their server.
You are allowed to download the files provided on this website for personal or commercial use, subject to the condition that they are used lawfully. All files are the property of their respective owners.
The content on the website is provided AS IS for your information and personal use only. It may not be sold, licensed, or shared on other websites without obtaining consent from the author.
E N D
Presentation Transcript
The trace of a reaction path calculated in React can be overlain on Act2 or Tact diagrams. The working directory, where calculation results will be saved. In the model, K-feldspar is titrated into an acidic fluid.
React runs and generates text format (React_output.txt) and plot format (React_plot.gtp) output files in the specified working directory.
Create an Act2 or Tact diagram, then left-drag the .gtp file onto it or, go to File Open Reaction Trace and browse to the .gtp file.
Reaction trace shows how mineral stability and fluid chemistry evolve as K-feldspar dissolves into the system. End of simulation Start of simulation Check to show markers. Each represents an addition of K-feldspar to the system.
In GWB12, you can overlay multiple reaction traces on Act2 or Tact diagrams. Customize markers and lines for each reaction trace. Each assumes a different silica polymorph forms, which affects stable mineral assemblages. Click add and select the desired .gtp files from React simulations.