Project Modelling and Work Breakdown Structures
Project
Modelling
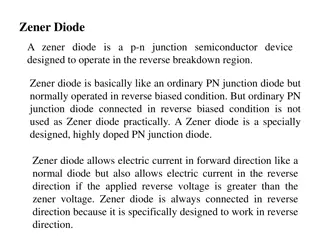
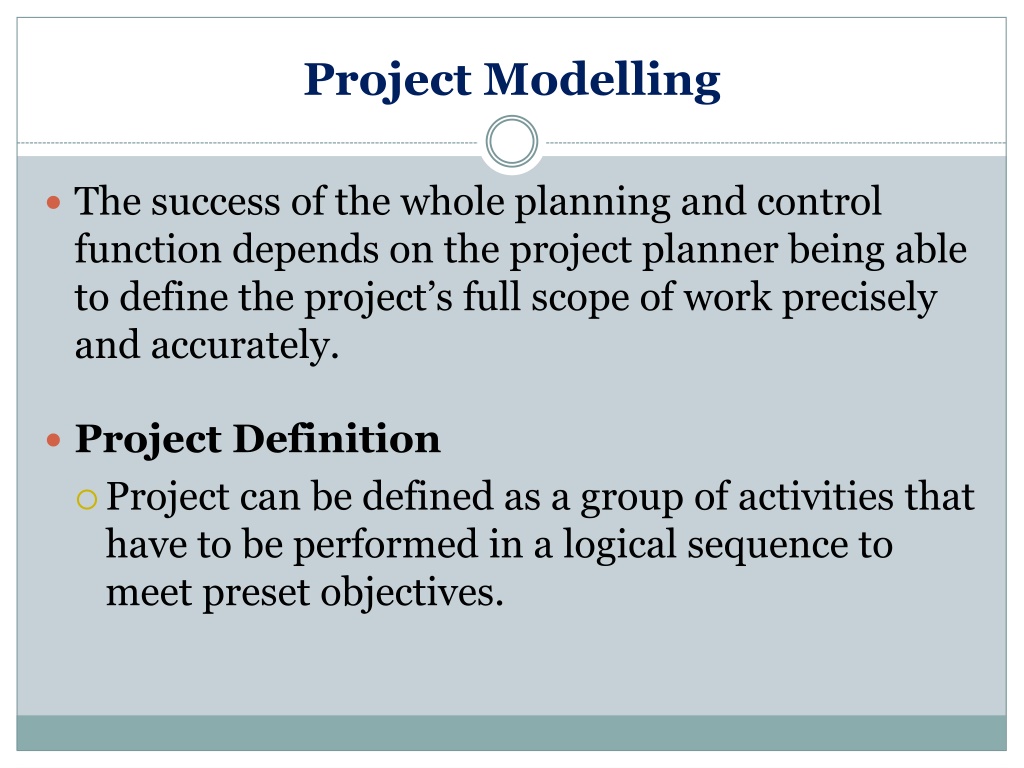
The success of the whole planning and control
function depends on the project planner being able
to define the project’s full scope of work precisely
and accurately.
Project Definition
Project can be defined as a group of activities that
have to be performed in a logical sequence to
meet preset objectives.
Project
Modelling
The Work Breakdown Structure (WBS) provides a
useful tool to address this need efficiently.
Project
Modelling
The project is represented by a hierarchical
structure that is designed to logically sub-divide all
the work-elements of the project.
Project
Modelling
The goal of the project is placed at the top of the
diagram and then it is sub-divide into smaller
elements of work at each lower level of breakdown.
Project
Modelling
At the lowest level of the EBS the element of work
is called work package.
Each element is identified by a short description.
Project
Modelling
The Work Breakdown Structure is useful for the
general understanding of the project but we need a
different view of the same structure in order to be
able to make an efficient utilization of the
breakdown structure.
We need to know which activities must be done in a
specific order (precedence) and which activities
could be done in parallel.
…
a group of activities that have to be performed in
a logical sequence
..
.
Example: Stopping at Petrol Station
Construct dependency table for the following jobs in
attending to a motor car at a service station
Example: Stopping at Petrol Station
Construct dependency table for the following jobs in
attending to a motor car at a service station
Example: Stopping at Petrol Station
Construct dependency table for the following jobs in
attending to a motor car at a service station
Example: Stopping at Petrol Station
Construct dependency table for the following jobs in
attending to a motor car at a service station
Example: Stopping at Petrol Station
Construct dependency table for the following jobs in
attending to a motor car at a service station
Example: Stopping at Petrol Station
Construct dependency table for the following jobs in
attending to a motor car at a service station
Example: Stopping at Petrol Station
Draw the relevant network of activities using given
precedencies.
Start
A
B
F
H
J
C
G
…
…
…
…
…
…
Network analysis
In order to analyze the network, we need to include more
pieces of information in a convenient form.
There is an convention that activities are represented as
boxes. The box is subdivided to give information about the
name/code of the activity, its duration, earliest start, latest
start, earliest finish, latest finish and total float.
Network analysis
The earliest start
for an activity is determined by the
earliest finish of preceding activities.
Earliest finish
is obtained by adding the activity duration.
Network analysis
The latest finish
for an activity is determined by the latest
start for succeeding activities.
The l
atest start
is obtained by subtracting the activity
duration.
The overall completion time
for the project
is the
earliest finish for the last activity.
Network analysis
Example:
Consider the following project and draw the
activity network
:
What is the overall completion time for this project?
Example
Draw the activity network including „dummy“ activities
Start
and
End
:
Example
Calculation of the earliest possible start and finish of each
activity
:
0
0
0
0
2
2
6
4
4
1
0
1
0
1
4
1
4
1
4
Example
We have completed
the forward pass through the activity
network:
Example
Backward pass: calculation of the latest possible start and
finish of each activity
:
0
0
0
2
2
6
4
4
10
10
14
14
1
4
Example
Calculation of the earliest possible start and finish of each
activity
:
0
0
0
0
2
2
6
4
4
1
0
1
0
1
4
1
4
1
4
1
4
1
4
1
4
1
0
1
0
1
0
6
6
4
4
4
0
0
0
Example
We have completed
the backward pass through the activity
network:
Example
Calculate the float for each activity (
=
late start-early start):
Example
Indicate the critical path (activities whit zero float):
Example
Useful check-points:
There is always at least one critical path
The total float on each branch of the network remains constant
Critical Path Method
/CPM
1.
Develop a list of activities that make up the project.
2.
Determine the immediate predecessor activities for each activity in the project.
3.
Estimate the completion time for each activity.
4.
Draw a network depicting the activities and immediate predecessors listed in
steps 1 and 2.
5.
Using the network and activity time estimates, determine the earliest start time
and earliest finish time for each activity by making forward pass through the
network. The earliest finish time for the last activity in the project identifies the
total time required to complete the project.
6.
Using the project completion time identified in step 5 as the latest finish time
for the last activity, make backward pass through the network to identify the
latest start time and latest finish time for each activity.
7.
Use difference between the latest start time and earliest start time for each
activity to identify the slack time available for the activity.
8.
The critical path activities are the activities with zero slack.
Critical Path Method
/CPM
Critical
Path Method
Determines the overall time needed for the project
completion
Facilitates the development of the activity schedule for the
project
Indicates critical activities
Shows us how much time reserve (slack/float) we have for
each activity
Helps us to control and manage the relevant project
Network analysis
Example
2:
Draw the network and identify the critical path.
Network analysis
Example
2:
Network analysis
Example
2:
CPM network provides us a very practical, easy and
straightforward tool for project control and what if analysis.
What is likely to happen when …?
Activity B started 1 week later.
Activity D started on time (as scheduled) but due to some operational
problems it takes one week more than estimated.
Activity I can be completed in 2 weeks only.
Network analysis
Example
2:
Activity B started 1 week later.
It will delay the whole project by one week.
Network analysis
Example
2:
Activity D started on time (as scheduled) but due to some operational
problems it takes one week more than estimated.
It is not a problem and we can still complete it on time.
Network analysis
Example
2:
Activity I can be completed in 2 weeks only.
It could make the whole project one week shorter.
Network analysis
Example
3:
Draw the network and identify the critical path.
Network analysis
Example
3:
W
hat if analysis
:
Activity B started 1 week later.
It will delay the whole project by one week.
Activity G started 4 weeks later than scheduled.
It is not a problem and we can still complete it on time.
Activity A can be completed in 3 weeks only.
It could make the whole project 2 weeks shorter.
Activity C will be completed in 6 weeks only.
There are two critical paths. Therefore, without further changes on
the sub
-
path B-E there is no chance for shortening the total time of
the project.
Network analysis
Homework:
Draw the network and identify the critical path.
In project management, precise project definition is crucial for successful planning and control. Project modelling involves utilizing tools like Work Breakdown Structure (WBS) to efficiently define project scopes and hierarchies. By breaking down the project into smaller elements of work, WBS aids in understanding and organizing tasks. Additionally, understanding activity dependencies and sequences is vital for effective utilization of the breakdown structure. An example of task dependencies at a petrol station highlights the importance of logical sequencing in project activities.

Download Presentation

Please find below an Image/Link to download the presentation.
The content on the website is provided AS IS for your information and personal use only. It may not be sold, licensed, or shared on other websites without obtaining consent from the author.If you encounter any issues during the download, it is possible that the publisher has removed the file from their server.
You are allowed to download the files provided on this website for personal or commercial use, subject to the condition that they are used lawfully. All files are the property of their respective owners.
The content on the website is provided AS IS for your information and personal use only. It may not be sold, licensed, or shared on other websites without obtaining consent from the author.
E N D
Presentation Transcript
Project Modelling The success of the whole planning and control function depends on the project planner being able to define the project s full scope of work precisely and accurately. Project Definition Project can be defined as a group of activities that have to be performed in a logical sequence to meet preset objectives.
Project Modelling The Work Breakdown Structure (WBS) provides a useful tool to address this need efficiently.
Project Modelling The project is represented by a hierarchical structure that is designed to logically sub-divide all the work-elements of the project.
Project Modelling The goal of the project is placed at the top of the diagram and then it is sub-divide into smaller elements of work at each lower level of breakdown.
Project Modelling At the lowest level of the EBS the element of work is called work package. Each element is identified by a short description.
Project Modelling The Work Breakdown Structure is useful for the general understanding of the project but we need a different view of the same structure in order to be able to make an efficient utilization of the breakdown structure. We need to know which activities must be done in a specific order (precedence) and which activities could be done in parallel. a group of activities that have to be performed in a logical sequence ...
Example: Stopping at Petrol Station Construct dependency table for the following jobs in attending to a motor car at a service station Duration [sec] 30 10 120 45 25 20 15 80 100 15 60 25 30 50 5 10 Preceding activity Activity Description Driver arrives Select brands of oil and petrol Fill petrol tank Prepare bill Receive payment Wash windscreens Polish windscreens Check tyre pressures Inflate tyres Open bonnet Check oil requirements Add oil Add distilled water to battery Fill radiator Close bonnet Driver departs A B C D E F G H I J K L M N O P
Example: Stopping at Petrol Station Construct dependency table for the following jobs in attending to a motor car at a service station Duration [sec] 30 10 120 45 25 20 15 80 100 15 60 25 30 50 5 10 Preceding activity None Activity Description Driver arrives Select brands of oil and petrol Fill petrol tank Prepare bill Receive payment Wash windscreens Polish windscreens Check tyre pressures Inflate tyres Open bonnet Check oil requirements Add oil Add distilled water to battery Fill radiator Close bonnet Driver departs A B C D E F G H I J K L M N O P
Example: Stopping at Petrol Station Construct dependency table for the following jobs in attending to a motor car at a service station Duration [sec] 30 10 120 45 25 20 15 80 100 15 60 25 30 50 5 10 Preceding activity None A Activity Description Driver arrives Select brands of oil and petrol Fill petrol tank Prepare bill Receive payment Wash windscreens Polish windscreens Check tyre pressures Inflate tyres Open bonnet Check oil requirements Add oil Add distilled water to battery Fill radiator Close bonnet Driver departs A B C D E F G H I J K L M N O P
Example: Stopping at Petrol Station Construct dependency table for the following jobs in attending to a motor car at a service station Duration [sec] 30 10 120 45 25 20 15 80 100 15 60 25 30 50 5 10 Preceding activity None A B Activity Description Driver arrives Select brands of oil and petrol Fill petrol tank Prepare bill Receive payment Wash windscreens Polish windscreens Check tyre pressures Inflate tyres Open bonnet Check oil requirements Add oil Add distilled water to battery Fill radiator Close bonnet Driver departs A B C D E F G H I J K L M N O P
Example: Stopping at Petrol Station Construct dependency table for the following jobs in attending to a motor car at a service station Duration [sec] 30 10 120 45 25 20 15 80 100 15 60 25 30 50 5 10 Preceding activity None A B C, L Activity Description Driver arrives Select brands of oil and petrol Fill petrol tank Prepare bill Receive payment Wash windscreens Polish windscreens Check tyre pressures Inflate tyres Open bonnet Check oil requirements Add oil Add distilled water to battery Fill radiator Close bonnet Driver departs A B C D E F G H I J K L M N O P
Example: Stopping at Petrol Station Construct dependency table for the following jobs in attending to a motor car at a service station Duration [sec] 30 10 120 45 25 20 15 80 100 15 60 25 30 50 5 10 Preceding activity None A B C, L D A F A H A J K, B J J L, M, N E, G, I, O Activity Description Driver arrives Select brands of oil and petrol Fill petrol tank Prepare bill Receive payment Wash windscreens Polish windscreens Check tyre pressures Inflate tyres Open bonnet Check oil requirements Add oil Add distilled water to battery Fill radiator Close bonnet Driver departs A B C D E F G H I J K L M N O P
Example: Stopping at Petrol Station Draw the relevant network of activities using given precedencies. Duration [sec] 30 10 120 45 25 20 15 80 100 15 60 25 30 50 5 10 Preceding activity None A B C, L D A F A H A J K, B J J L, M, N E, G, I, O Activity Description Driver arrives Select brands of oil and petrol Fill petrol tank Prepare bill Receive payment Wash windscreens Polish windscreens Check tyre pressures Inflate tyres Open bonnet Check oil requirements Add oil Add distilled water to battery Fill radiator Close bonnet Driver departs A B C D E F G H I J K L M N O P B C Start A F G H J
Network analysis In order to analyze the network, we need to include more pieces of information in a convenient form. There is an convention that activities are represented as boxes. The box is subdivided to give information about the name/code of the activity, its duration, earliest start, latest start, earliest finish, latest finish and total float. Early start Early finish Total Float Activity Name Duration Late Start Late Finish
Network analysis Early start Early finish Total Float Activity Name Duration Late Start Late Finish The earliest start for an activity is determined by the earliest finish of preceding activities. Earliest finish is obtained by adding the activity duration.
Network analysis Early start Early finish Total Float Activity Name Duration Late Start Late Finish The latest finish for an activity is determined by the latest start for succeeding activities. The latest start is obtained by subtracting the activity duration. The overall completion time for the project is the earliest finish for the last activity.
Network analysis Example: Consider the following project and draw the activity network: Preceding activity none none A B C, D Activity Duration [hours] A B C D E 2 4 4 6 4 What is the overall completion time for this project?
Example Draw the activity network including dummy activities Start and End: A 2 C 4 St E 4 0 0 End B 4 D 6
Example Calculation of the earliest possible start and finish of each activity: 2 6 0 2 A 2 C 4 10 14 14 14 0 0 St E 4 0 0 End 0 4 4 10 B 4 D 6
Example We have completed the forward pass through the activity network: 0 2 2 6 A 2 C 4 0 0 10 14 14 14 St 0 E 4 0 End 0 4 4 10 B 4 D 6
Example Backward pass: calculation of the latest possible start and finish of each activity: 2 6 0 2 A 2 C 4 10 14 14 14 0 0 St E 4 0 0 End 0 4 4 10 B 4 D 6
Example Calculation of the earliest possible start and finish of each activity: 2 6 0 2 A 2 C 4 4 6 6 10 10 14 14 14 0 0 St E 4 0 0 0 End 14 14 10 0 14 0 4 4 10 B 4 4 D 6 0 10 4
Example We have completed the backward pass through the activity network: 0 2 2 6 A 2 C 4 4 6 6 10 0 0 10 14 14 14 St 0 E 4 0 End 0 0 10 14 14 14 0 4 4 10 B 4 D 6 0 4 4 10
Example Calculate the float for each activity (=late start-early start): 0 2 2 6 A 2 C 4 4 4 4 6 6 10 0 0 10 14 14 14 St 0 E 4 0 0 0 0 End 0 0 10 14 14 14 0 4 4 10 B 4 D 6 0 0 0 4 4 10
Example Indicate the critical path (activities whit zero float): 0 2 2 6 A 2 C 4 4 4 4 6 6 10 0 0 10 14 14 14 St 0 E 4 0 0 0 0 End 0 0 10 14 14 14 0 4 4 10 B 4 D 6 0 0 0 4 4 10
Example Useful check-points: There is always at least one critical path The total float on each branch of the network remains constant 0 2 2 6 A 2 C 4 4 4 4 6 6 10 0 0 10 14 14 14 St 0 E 4 0 0 0 0 End 0 0 10 14 14 14 0 4 4 10 B 4 D 6 0 0 0 4 4 10
Critical Path Method/CPM 1. Develop a list of activities that make up the project. 2. Determine the immediate predecessor activities for each activity in the project. 3. Estimate the completion time for each activity. 4. Draw a network depicting the activities and immediate predecessors listed in steps 1 and 2. 5. Using the network and activity time estimates, determine the earliest start time and earliest finish time for each activity by making forward pass through the network. The earliest finish time for the last activity in the project identifies the total time required to complete the project. 6. Using the project completion time identified in step 5 as the latest finish time for the last activity, make backward pass through the network to identify the latest start time and latest finish time for each activity. 7. Use difference between the latest start time and earliest start time for each activity to identify the slack time available for the activity. 8. The critical path activities are the activities with zero slack.
Critical Path Method/CPM CriticalPath Method Determines the overall time needed for the project completion Facilitates the development of the activity schedule for the project Indicates critical activities Shows us how much time reserve (slack/float) we have for each activity Helps us to control and manage the relevant project
Network analysis Example 2: Draw the network and identify the critical path. Activity Preceding Activity Duration [weeks] A B C D E F G H I None None None A B B C D, E F, G, H 7 8 6 6 6 8 4 7 3
Network analysis Example 2: 0 1 1 7 7 8 7 1 8 13 6 14 A D 14 0 14 21 7 21 H 8 0 8 14 6 14 E 21 0 21 24 3 24 24 0 En 0 24 24 0 0 0 0 0 0 0 0 0 8 8 8 I St B 24 8 5 13 16 8 21 F 0 11 C 11 6 6 17 6 11 G 17 10 4 21
Network analysis Example 2: CPM network provides us a very practical, easy and straightforward tool for project control and what if analysis. What is likely to happen when ? Activity B started 1 week later. Activity D started on time (as scheduled) but due to some operational problems it takes one week more than estimated. Activity I can be completed in 2 weeks only.
Network analysis Example 2: Activity B started 1 week later. 0 1 1 7 7 8 7 1 D 6 8 13 A 14 0 H 7 14 21 14 21 8 0 8 14 6 14 E 21 0 21 24 3 24 24 0 En 0 24 24 0 0 St 0 0 0 0 0 0 8 8 8 I B 24 0 8 5 16 8 21 F 13 0 6 6 6 10 11 C 11 11 G 4 17 17 21 It will delay the whole project by one week.
Network analysis Example 2: Activity D started on time (as scheduled) but due to some operational problems it takes one week more than estimated. 0 1 1 7 7 8 7 1 D 6 8 13 A 14 0 H 7 14 21 14 21 8 0 8 14 6 14 E 21 0 21 24 3 24 24 0 En 0 24 24 0 0 St 0 0 0 0 0 0 8 8 8 I B 24 0 8 5 16 8 21 F 13 0 6 6 6 10 11 C 11 11 G 4 17 17 21 It is not a problem and we can still complete it on time.
Network analysis Example 2: Activity I can be completed in 2 weeks only. 0 1 1 7 7 8 7 1 D 6 8 13 A 14 0 H 7 14 21 14 21 8 0 8 14 6 14 E 21 0 21 24 3 24 24 0 En 0 24 24 0 0 St 0 0 0 0 0 0 8 8 8 I B 24 0 8 5 16 8 21 F 13 0 6 6 6 10 11 C 11 11 G 4 17 17 21 It could make the whole project one week shorter.
Network analysis Example 3: Draw the network and identify the critical path. Activity Preceding Activity Duration [weeks] A B C D E F G H None A A A B C D E, F 5 4 7 4 5 2 4 7
Network analysis Example 3: What if analysis: Activity B started 1 week later. It will delay the whole project by one week. Activity G started 4 weeks later than scheduled. It is not a problem and we can still complete it on time. Activity A can be completed in 3 weeks only. It could make the whole project 2 weeks shorter. Activity C will be completed in 6 weeks only. There are two critical paths. Therefore, without further changes on the sub-path B-E there is no chance for shortening the total time of the project.
Network analysis Homework: Draw the network and identify the critical path. Activity A B C D E F G H I Preceding Activity None None A, B B B C D D, E F, G, H Duration [weeks] 4 6 7 8 5 5 7 8 4