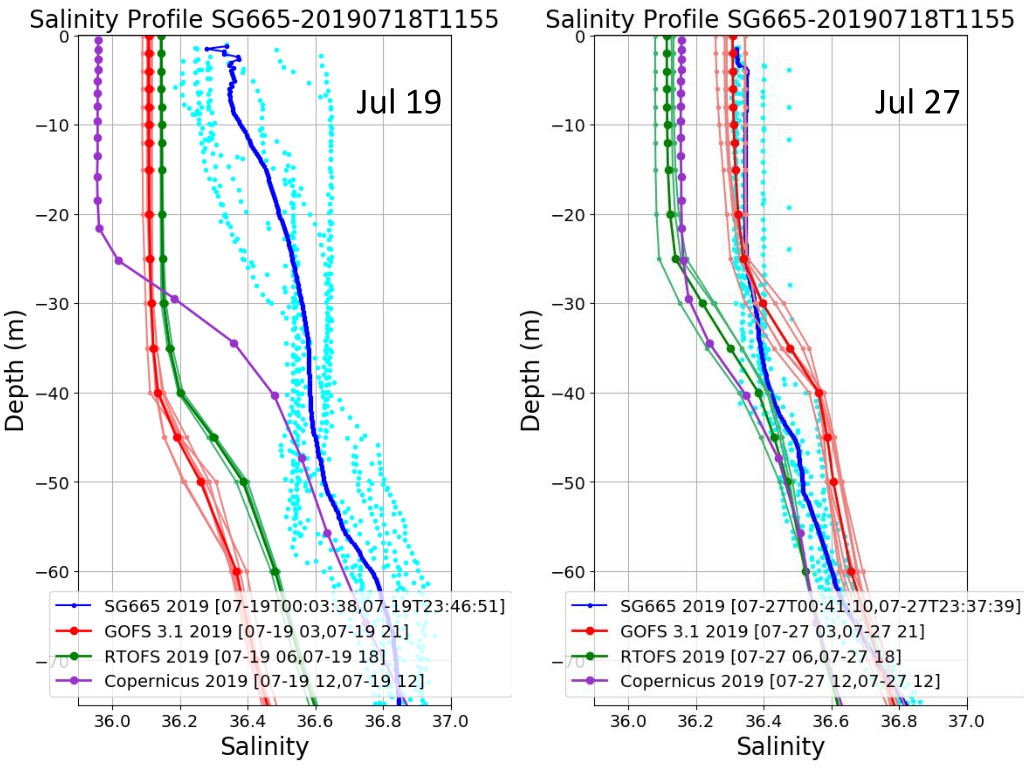
Progressive Improvement in Salinity Levels: Jul.19 - Jul.27
Jul 19
Jul 27
Jul 19
Jul 27
SG665 Salinity at Deployment
Jul 19
Jul 20
Jul 21
Jul 22
Jul 23
Jul 24
Jul 25
Jul 27
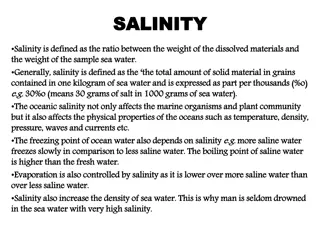
Large Salinity
offset surface
to 160 m
Salinity
Progressively
Improves over
1 week period
Jul 19
Jul 27
SG665 Salinity at Deployment
Monitoring the salinity levels from deployment to surface at different depths over a one-week period from Jul. 19 to Jul. 27. Witness the gradual enhancement in salinity levels reflecting the dynamic oceanic environment. The visual representation through images showcases the noteworthy changes providing insights into the marine ecosystem's temporal variability.

Uploaded on Feb 27, 2025 | 0 Views
Download Presentation

Please find below an Image/Link to download the presentation.
The content on the website is provided AS IS for your information and personal use only. It may not be sold, licensed, or shared on other websites without obtaining consent from the author.If you encounter any issues during the download, it is possible that the publisher has removed the file from their server.
You are allowed to download the files provided on this website for personal or commercial use, subject to the condition that they are used lawfully. All files are the property of their respective owners.
The content on the website is provided AS IS for your information and personal use only. It may not be sold, licensed, or shared on other websites without obtaining consent from the author.
E N D
Presentation Transcript
Jul 19 Jul 27
Jul 19 Jul 27
SG665 Salinity at Deployment Large Salinity offset surface to 160 m Jul 22 Jul 19 Jul 20 Jul 21 Salinity Progressively Improves over 1 week period Jul 23 Jul 24 Jul 25 Jul 27
SG665 Salinity at Deployment Jul 19 Jul 27