Progress Update on Municipal Support and Improvement Plans
This presentation provides an update to the COGTA Portfolio Committee on the progress made in implementing recommendations outlined in the State of Local Government report. Key focus areas include enhancing governance, service delivery, financial management, capacity building, and economic development at the local government level. The report also addresses challenges and interventions aimed at strengthening municipalities across the country.
Download Presentation

Please find below an Image/Link to download the presentation.
The content on the website is provided AS IS for your information and personal use only. It may not be sold, licensed, or shared on other websites without obtaining consent from the author.If you encounter any issues during the download, it is possible that the publisher has removed the file from their server.
You are allowed to download the files provided on this website for personal or commercial use, subject to the condition that they are used lawfully. All files are the property of their respective owners.
The content on the website is provided AS IS for your information and personal use only. It may not be sold, licensed, or shared on other websites without obtaining consent from the author.
E N D
Presentation Transcript
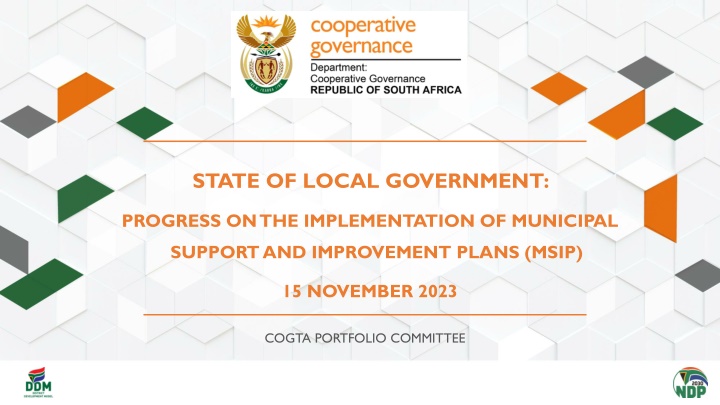
STATE OF LOCAL GOVERNMENT: PROGRESS ON THE IMPLEMENTATION OF MUNICIPAL SUPPORT AND IMPROVEMENT PLANS (MSIP) 15 NOVEMBER 2023 COGTA PORTFOLIO COMMITTEE
TABLE OF CONTENTS 1. 2. 3. 4. 5. 6. 7. PURPOSE BACKGROUND CIRCULAR 88 IN RESPECT OF THE SOLG REPORT AND THE MPAT STATE OF LG REPORT 2021/22 PICTURE COGTA EFFORTS TO ADDRESS CHALLENGES AND STRENGTHEN LOCAL GOVERNMENT INTERVENTIONS AND SUPPORT IN RESPONSE TO THE SoLG ASSESSMENT OUTCOMES PROGRESS PER PILLAR a) Putting People First b) Delivering Basic Services c) Good Governance d) Sound Financial Management e) Building Capable Local Government Institutions f) Local Economic Development CONCLUSIONS RECOMMENDATIONS 8. 9. 2
PURPOSE The purpose of the presentation is to: Provide a progress report to the Portfolio Committee on the implementation of the recommendations in the State of Local Government report as presented to the Portfolio Committee during November 2022. Outline to the Portfolio Committee some of the interventions that are implemented to support municipalities in terms of Section 154 of the Constitution. Within the context of the seven priorities of the 6thadministration, Cogta committed to focus on: Strengthening the institution (DGOG) to deliver on its mandate; Strengthen cooperative governance (IGR horizontal and vertical integration); Policy compliance, wall-to-wall review, powers and functions and funding model for local government; Disaster risk reduction; Institutional development, governance and citizen participation; Integrated planning for spatial transformation and inclusive economic growth; and Infrastructure, service delivery and job creation. Thus, this report is guided by these commitments in respect of the support provided to municipalities across the country. 3
BACKGROUND The Minister for Cooperative Governance and Traditional Affairs (COGTA) tabled the State of Local Government Report to Cabinet on 30 June 2021. Cabinet called on CoGTA, National Treasury and service-delivery departments to strengthen their support to municipalities in line with the District-based Development Model (DDM) and their responsibilities as provided for in Sec 154 of the Constitution Consequent to that the SoLG Report was tabled in the Portfolio Committee meetings of 3 and 24 August 2021. The Chairperson at the time directed that the Committee would follow up quarterly on the municipalities with unfunded budgets and those under Sec 139 interventions. The Municipal Support and Interventions Plans (MSIPs) have been implemented across all nine provinces. The purpose of this report is thus to report progress on the implementation of such MSIPs across the nine provinces since the last report was presented to the Portfolio Committee in November 2022. 4
KEY CHALLENGES 1. The SoLG Report, amongst other matters, confirmed correlation between failures in governance and political oversight as the primary causes underpinning the increase in the number of dysfunctional municipalities. These failures are also attributed to the lack of adequate support from National and Provincial Government departments and other service delivery departments 2. The huge year-on-year percentage increase in average outstanding debt per municipality owed to Eskom, DWS and Water Boards and other suppliers of goods and services is a clear indication that the majority of municipalities are not honouring payment arrangements with the suppliers of bulk services and that virtually no progress has been made to reduce the debt owed to the suppliers of bulk services. Vacancies in key senior management positions within distressed municipalities remains a serious challenge. The absence of CFOs in municipalities impact sound financial management and vacancies in the technical departments compromise service delivery. 3. 4. The implementation of Section 20(2) of the DoRA, Schedule 6B conversion is one of the levers available to prevent under-expenditure or improve the level of service delivery in municipalities is on course. This policy empowers the relevant transferring officer convert any portion of an allocation listed in Part B of Schedule 5 to one listed in Part B of Schedule 6 if it is satisfied that the receiving officer/municipality is still not capable of fully meeting the requirements of the allocation, among others. Support of Councils is critical for this mechanism to become effective 5. Most of the dysfunctional municipalities are faced with revenue challenges, some of which are caused by the negative economic outlook and unemployment. National and provincial governments continue to support municipalities with revenue enhancing initiatives 5
6 STATE OF LOCAL GOVERNMENT OVERVIEW: INDICATORS (INCL LED) Service Delivery Financial Management LED Political Administrative Governance In-fighting in councils Intra-political party divisions in council Divisions in caucuses External political interference in councils Persistent & frequent section 139 interventions (esp. on dissolution of councils) Council not meeting as regulated Committees of council not meeting Council taking wrongful decisions No oversight by council on administration Poor and weak decision-making by council Councilors unduly interfering in administration No consequence management on corruption, maladministration, nepotism & poor performance Frequent Labour disputes and disruptions Poor public participation processes Vacancies in key positions Bloated structures Poor performance management and lack of consequence management Non-compliance: legislation, regulations and policies Unfunded budget Incapacitated and incompetent Budget & Treasury Offices (BTO) Excessive salary bills Non submission or late submission of annual financial statements Disclaimer & adverse audit outcomes High debt to utilities and statutory obligations Flouted SCM processes Poor collection of revenue High basic services backlogs High number of informal settlements No maintenance of infrastructure resulting in water and electricity supply interruptions and poor water quality No technical capacity Glaring service delivery issues Perennial poor infrastructure grant expenditure Persistent service delivery protests Poor response: service delivery complaints Court actions by interest groups on poor service delivery Gross Value Added(GVA) by the municipality per capita decreasing Employment rate decreasing No LED Strategy LED Unit dysfunctional No Economic Recovery Plan activities included in the SDBIP No meetings with the Business Forums of the municipality DYSFUNCTIONAL Minimal in-fighting in council Elements of factionalism Regular Section 139 interventions Council meeting as scheduled with some external interruptions Reports on maladministration identified but not acted on by council Oversight conducted not fully effective Public participation not fully effective Vacancies in some key positions Structure not fully respondent to municipal needs Compliance to applicable legislation, regulations and policies not fully met BTO not fully capacitated vacancies in some positions Financial management policies in place, not fully implemented Weak revenue collection Debt owed to utilities & statutory obligations not fully services Annual financial statements late Qualified audit outcomes Weak revenue collection Debt owed to utilities & statutory obligations not fully services Reliance on consultants for Annual financial statements Basic services backlogs not fully met Repairs and maintenance not fully executed due to capacity and budget Infrastructure grants not fully spent Frequent service delivery protests Inadequate response to service delivery complaints Gross Value Added(GVA) by the municipality per capita negative Employment rate little decrease LED Strategy not older than 5yrs LED Unit vacancies Few Economic Recovery Plan activities included in the SDBIP Irregular scheduled meetings with the Business Forums of the municipality Gross Value Added(GVA) by the municipality per capita stable Employment rate stable LED Strategy not older than 3yrs LED Unit minimal vacancies Some Economic Recovery Plan activities included in the SDBIP Regular scheduled meetings with the Business Forums of the municipality Gross Value Added(GVA) by the municipality per capita improved Employment rate improved Updated LED Strategy LED Unit positions filled Economic Recovery Plan activities included in the SDBIP Regular scheduled meetings with the Business Forums of the municipality MED RISK Robust and functional Council No intra-party political divisions Council meeting as scheduled with no undue external influence Reports on maladministration identified Vacancies in key positions Structure not respondent to municipal needs Compliance to applicable legislation, regulations and policies not fully met Repairs and maintenance not fully executed due to capacity and budget Incapacity to response to service delivery complaints LOW RISK Cohesion in council Functional caucus No intra-party political divisions No section 139 interventions over 5 year period Council meeting regularly, as regulated Council adopts IDP, budget, policies, annual financial statements on an informed and efficient basis Council provides effective oversight over administration Fully funded budget Functional BTO Effective application of credit control and debt collection policies No or minimal outstanding debt to utilities & statutory obligations Community consultation on service delivery priorities Well capacitated and efficient infrastructure services department Uninterrupted delivery of services due to well maintained infrastructure Quick response and turnaround time to service delivery complaints Infrequent service delivery protests Structure fully respondent to municipal needs No vacancies in key and senior positions (positions occupied by competent individuals) Full compliance with legislation, regulations and policies STABLE
STATE OF LOCAL GOVERNMENT OVERVIEW 2021 2022 Dysfunctional (Red) Medium Risk (Orange) Low Risk (Yellow) Stable (Green) Dysfunctional (Red) Medium Risk (Orange) Low Risk (Yellow) Stable (Green) 64 111 66 16 66 107 54 30 24,90% 43,19% 25,68% 6,22% 25,68% 41,63% 21,01% 11,67% 7
IMPLEMENTATION OF CIRCULAR 88 IN RESPECT OF THE SOLG REPORT AND THE MPAT Previous State of Local Government Report , 2021/22 showed limitations to assess and categorise municipalities across provinces. Indicators included within tool serve as prioritised subset (49) of the Circ. 88 indicators, drawn from same definitional catalogue MPAT: The merit of the MPAT is that it is a self-assessment by municipalities, and it immediately produces the outcomes. Draft MPAT developed (2023) to uniformly assess and categorise municipalities across provinces. Avoids risk of duplication The finalisation of the assessment of Municipalities for 22/23 through the Municipal Performance Assessment Tool (MPAT) will be processed through Provincial structures before the National SoLG report will be submitted to Cabinet and eventually to the Portfolio Committee. Coherent and standardised tool will only yield credible results if underlying data utilised is complete, valid and reliable. Builds on existing indicator standardisation reforms and integrates with them Uniformly assess and categorise municipalities Therefore, MPAT builds on and relies on existing joint Circ Nr 88 indicators and their Technical Indicator Descriptions as basis for each indicator. 8
COGTA EFFORTS OVER THE PAST FIVE (5) YEARS TO ADDRESS CHALLENGES AND TO STRENGTHEN LOCAL GOVERNMENT Consistent with the dictates of Section 154 of the Constitution and in response to various challenges confronting municipalities, CoGTA, working with Provinces, National Treasury, SALGA and other partners introduced legislative and policy reforms to enable municipalities to effectively perform their powers and functions, including: The 2021 review of the Municipal Structures Act, 117 of 1998 The review laid the foundation for the separation of powers between the executive and legislative arms of the municipal council. The reinforcement of the Code of Conduct for Councillors. The recognition of the Municipal Public Accounts Committees (MPAC) and the introduction of the whip of Council for all municipalities. The 2022 review of the Municipal Systems Act, 32 of 2000 The review was a reintroduction of the 2011 amendment of the Municipal Systems Amendment Act, 07 of 2011 which was struck down by the Constitutional Court in 2019. The introduction of the Municipal Systems Act: Municipal Staff Regulations of 2021, laid a solid foundation for the achievement of the objective to professionalise local government. Revised competency assessment batteries are also being finalised to further strengthen professionalisation interventions. CoGTA, working with National Treasury introduced the Circular 88 back in 2017 which was aimed at supporting the alignment of planning and reporting instruments using a prescribed set of municipal performance indicators. Circular 88 is in keeping with the Municipal Systems Act (MSA) and the MFMA requirement for alignment between planning and reporting instruments such as the Integrated Development Plan (IDP), the Service Delivery and Budget Implementation Plan (SDBIP) and the Annual Report. Circular 88 is currently being piloted across all 8 Metropolitan Municipalities and will later be rolled out to all municipalities to streamline reporting. 9
COGTA EFFORTS OVER THE PAST FIVE (5) YEARS TO ADDRESS CHALLENGES AND TO STRENGTHEN LOCAL GOVERNMENT cont In 2020 Cogta implemented changes in the MIG/IUDG Framework to allow municipalities to use a portion of their MIG/IUDG allocation to buy specialised waste management vehicles servicing the poor. Some municipalities have used this opportunity and the 2022 Census data released by the Stats SA in October 2023 indicates a nominal increase to 66% (63% in 2011) in the collection of waste by municipalities. In the same period 2020/2021 the Department revised the MIG/IUDG Framework to allow municipalities to use up 5% of their MIG/IUDG allocation develop Infrastructure Asset Management Plans. MISA was tasked specifically to support municipalities in this regard. Municipalities with non-compliance pre-directives or directives are allowed to use up to 10% of their MIG/IUDG allocation for urgent repairs and maintenance in respect of water and sanitation. This provision has been carried over from Covid-19 special provisions. Cogta has also set up the Results Management Office (RMO) to house experts in various fields (DDM, CWP, Infrastructure, Finance, Energy and Governance) to provide an additional layer of support, particularly in dysfunctional municipalities The strengthening of the Municipal Infrastructure Support Agent (MISA) has been ongoing. MISA has been designated by the Minister to champion the development of Infrastructure Asset Management Plans, the Schedule 6b, the deployment of more experts, trainee artisans as well as supporting the implementation of the CWP programme (particularly the municipal services aspects). 10
COGTA INTERVENTIONS IN THE GOVERNANCE PIPELINE Finalisation of the Intergovernmental, Monitoring, Support and Interventions (IMSI) Bill o Bill has been developed in compliance with sections 100(3) and 139(8) of the Constitution to provide for targeted support to provinces and municipalities in need of assistance; monitoring of provinces and municipalities as to the fulfilment of their executive obligations in terms of the Constitution or legislation; alternative steps to interventions to induce compliance by provinces or municipalities with their executive obligations; and Appointment of administrators by the intervening national executive or provincial executive. Coalitions Bill amendments are being proposed to the Municipal Structures Act so as to (amongst others) o change municipalities with a mayoral executive system, in which no party obtained a majority of seats, to a collective executive system; o to provide for the removal of municipal office-bearers from office only after two years have passed since they were elected or on prescribed grounds; and o Consultation being undertaken with stakeholders. o to provide for binding coalition agreements in municipalities in which no party has a majority of seats. General Laws Amendment Bill (GLAB) will propose amendments to various pieces of legislation impacting on local government to ensure that good practices are entrenched; vacuums provided for; and bad practices eradicated / mitigated. 11
INTERVENTIONS AND SUPPORT IN RESPONSE TO THE SoLG ASSESSMENT OUTCOMES
PACKAGE OF SUPPORT FOR MUNICIPALITIES IN DYSFUNCTIONAL & UNDER INTERVENTION INTERVENTIONS AIMED AT STRENGTHENING GOVERNANCE CAPACITY INTERVENTIONS AIMED AT STRENGTHENING INSTITUTIONAL CAPACITY INTERVENTIONS AIMED AT IMPROVING FINANCIAL VIABILITY INTERVENTIONS AIMED AT ACCELERATING SERVICE DELIVERY AND ECONOMIC DEVELOPMENT Support during senior manager recruitment processes. Deployment of Governance Experts at municipalities Deployment of Finance Experts by Provincial Treasury to support municipalities with implementation of the Audit Action Plan; POE preparation; support in the compilation of IFS and AFS; addressing UIFW and skilling SCM employees on prevention of UIFW expenditure; revenue enhancement strategies; Skills transfer to the Budget Treasury Offices (BTOs). Deployment of Technical Experts & PMU Teams of Engineers and Project Managers to distressed municipalities. Deployment of Finance, Technical Experts and PMU teams at distressed municipalities. Training of MPAC structures. Funding for strategic infrastructure projects related to provision of basic services and LED. Orientation Workshops for Councillors One of the critical mandates of the deployed Experts and PMU Teams is skills transfer to the BTOs and Technical Departments of the benefitting municipalities. Grant funding for repairs and maintenance of aged infrastructure through the Accelerated Infrastructure Renewal Programme. Councillor Skills Audit Support during establishment of Ward Committees and revival of MRRTs. To address fundamental negative impact that results from the lack of infrastructure maintenance, COGTA and MISA to support willing municipalities with preparation of Business Plans to access: 5% of MIG for PMU 10% of MIG for O&M 5% of MIG for Asset Management Implementation of the cost of supply studies on water provision through the MSIG Coordinated support for records management to address weaknesses in evidence keeping for audit purposes, thus aiming to improve municipal audit outcomes of municipalities. Appoint Ministerial Representatives at municipalities under Section 139 intervention. Support to selected municipalities with development of tariffs that take into account the cost of providing municipal services with respect to electricity, water , waste water and waste removal. MISA, DWS, EDTEA to form part of provincial structures established to monitor and report on performance of distressed municipalities Capacity building of Councillors and municipal officials MISA, DWS, EDTEA and ESKOM to support in the form of project funding and technical professional support. Piloting and validation of the prototype (generic) staff establishments of municipalities (macro and micro- structures) Establish Water War Rooms in each of the Water Service Authorities (WSAs) 13
SOLG MSIPs AND FRPs DASHBOARD The Municipal Support and Intervention Plans (MSIPs) are interchangeable with Financial Recovery Plans (FRPs) where these exists. Of the 66 dysfunctional municipalities, 26 have FRPs in place. PROVINCES Dysfunctional No. of MSIP s (s154) No. of FRP s Eastern Cape 11 3 5 Free State 11 8 3 Gauteng 2 1 1 KwaZulu Natal 11 11 0 Limpopo 3 - 3 Mpumalanga 6 2 4 North-West 10 3 7 Northern Cape 9 7 2 Western Cape 2 1 1 14
SECTION 139(7) INTERVENTIONS IN LEKWA, MANGAUNG AND ENOCH MGIJIMA MUNICIPALITIES Lekwa LM in Mpumalanga was the first municipality where Sec 139(7) of the Constitution read together with section 150(1)(b) of the MFMA was invoked by National Government. 1. 2. National Cabinet intervened in Mangaung Metro in Free State due to persistent failures of the municipality to implement the FRP imposed by the FS Provincial Government. 3. The Enoch Mgijima in Eastern Cape was placed under Section 139 (7) of the Constitution on 6 April 2022 following the resistance to the 139 (5)(a) and (c) intervention by the EC Provincial Executive Council. 4. It is noted that while the National Government has removed the National Cabinet Representatives from these municipalities, the interventions in terms of Sec 139(7) subsist. 5. These interventions are implemented by the municipalities and progress is monitored through monthly reports and the Intervention War Rooms that sit regularly. 6. Progress varies from one municipality to the next but is generally slow in respect of financial and service delivery challenges. 15
SUMMARY OF PROGRESS ON THE IMPLEMENTATION OF THE FRPs IN LEKWA, MANGAUNG AND ENOCH MGIJIMA MUNICIPALITIES Pillar Focus Area Number of Activities 58 34 26 Completed In Not yet commenced 0 0 0 FRP Progress Dashboard - Lekwa Since the approval of the Financial Recovery Plan in October 2021, 50 out of 213 implementation plan activities (23%) have been completed. A further 159 (75%) activities are in progress, and 4 (2%)activities haven t started yet due to capacity constraints. Progress 49 18 16 Pillar 1 Pillar 2 Pillar 3 Governance Institutional Financial Service Delivery Total 9 16 10 Pillar 4 95 15 76 4 213 50 159 4 Pillar Focus Area Number of Activities 36 28 52 93 Completed In Not yet commenced 2 1 3 2 FRP Progress Dashboard - Mangaung Since the approval of the Financial Recovery Plan in October 2021, 93 out of 208 implementation plan activities (44%) have been completed. 116 (55%) activities are in progress or ongoing in nature and about 1% activities haven t started yet due to capacity constraints. Progress 29 13 28 46 Pillar 1 Pillar 2 Pillar 3 Pillar 4 Governance Institutional Financial Service Delivery 5 14 21 45 Total 209 85 116 8 Pillar Focus Area Number of Activities 55 15 24 45 139 Completed In Not yet commenced 22 1 8 32 63 FRP Progress Dashboard Enoch Mgijima Since the implementation of Phase 1 (Financial Rescue) of the approved FRP on the 14th of December 2022, 25 out of 139 implementation plan activities (18%) have been completed. A further 51 (37%) activities are in progress, while 63 (45%) activities haven t commenced. Progress 23 8 11 9 51 Pillar 1 Pillar 2 Pillar 3 Pillar 4 Governance Institutional Financial Service Delivery Total 10 6 5 4 25 16
PROGRESS PER PILLAR PILLAR 1 - PUTTING PEOPLE FIRST
PUTTING PEOPLE FIRST : ESTABLISHMENT OF WARD COMMITEES AS AT 09 NOVEMBER 2023 Province No. of wards No. of established ward committees No. outstanding ward committees Percentage The 55 Dysfunctional Local Municipalities have completed the process of establishing Ward Committees, except for Siyathemba and Kareeberg in the Northern Cape 710 710 0 100 % Eastern Cape 319 319 0 100% Free State 529 422 107 78% Gauteng 901 901 0 100% KwaZulu Natal 568 568 0 100% Limpopo 400 400 0 100% Mpumalanga 232 229 3 99% Northern Cape 403 403 0 100% North-West 406 406 0 100% Western Cape TOTAL 4 468 4 358 110 98% Outstanding ward committees: Gauteng: All 107 ward committees not yet established in City of Tshwane Northern Cape: 1 in Siyathemba LM 2 in Kareeberg LM 18
PUTTING PEOPLE FIRST: WARD COMMITTEE IMPLEMENTATION STATUS STATE OF LOCAL GOVERNMENT PERFORMANCE HIGH LEVEL OVERVIEW SATUS OF WARD COMMITTEES Of the 66 dysfunctional municipalities, 11 are District municipalities which by law do not have ward committees. Areas of Improvement All the dysfunctional local municipalities have established ward committees, and the functionality of these structures has relatively improved except for Ditsobotla LM in the NW. There has been improvement in the management and response to community complaints through various platforms, i.e. electronic complaints management systems and manual registers. As part of its support measures, the DCOG facilitates payment of stipends for all ward committee members in grades 1 , 2 and 3 municipalities through the Local Government Equitable Share grant (LGES). The allocation provides for an allowance to the value of R500 per ward committee member per month to complement financial support already provided by municipalities. The Department has also partnered with LGSETA to provide a capacity building and training skills programme at NQF level 2. The skills programme is conducted throughout the term of office and comprises of eight (8) modules. Delays in the establishment of ward committees (GP and NC) Areas of Regression Lack of funding to support ward committee operations beyond the payment of stipends For instance, in many municipalities, Ward Committees have not been supported to prepare Local Area Plans for their respective wards. 19
PROGRESS PER PILLAR PILLAR 2 - DELIVERING BASIC SERVICES
INFRASTRUCTURE ASSESSMENTS AND ANALYSIS Low & medium capacity municipalities do not have technical & financial capacity to perform infrastructure assets condition assessments. Infrastructure condition assessments inform long-term capital project planning, adequacy of annual maintenance funding, if any, and the structural & functional integrity of assets. MISA assists municipalities by conducting these assessments. To date 117 (out of 144) Water Service Authorities (WSAs) s bulk water and sanitation infrastructure has been assessed. The assessments reports with recommendations are being implemented and used to prioritise projects identification and funding through own funding, private sector funding and conditional grants like MIG, WSIG and RBIG. Currently the Sishen Mine in the Northern Cape Province in Gamagara Municipality and Anglo Platinum Mine in Limpopo Province are funding wastewater treatment works upgrades respectively after the municipalities considered the assessment reports. MISA has prioritised conducting infrastructure assessments in dysfunctional municipalities identified by the SOLG. In the current financial year, assessments are being conducted in 22 dysfunctional municipalities and the balance of the municipalities will be rolled out in the two outer years. The assessment reports also inform MISA s technical support plans to be provided to municipalities as well as projects to be prioritised for MIG 6B implementation
WATER, SANITATION AND ROADS CAPITAL PROJECTS Municipalities have not yet eradicated basic services backlogs as highlighted by Census 2022 results, because of a number of factors including lack of technical capacity. This is evident is unspent infrastructure grants and lack of operations and maintenance of existing infrastructure. MISA deploys built environment professionals to municipalities to provide technical support throughout all infrastructure product life cycle from integrated planning stage, project inception and planning, implementation, operations and maintenance funded through grants, private sector and own funding. To-date MISA has deployed 103 technical professionals (86 of which are professionally registered with Statutory bodies as engineers and town planners). MISA has implemented infrastructure projects budgeted in excess R200 million as a contribution towards eradication of basic services backlogs upon request by municipalities. MISA has implemented and completed water (mainly boreholes and associated infrastructure) and sanitation infrastructure projects benefitting more than 100 000 households. MISA has also implemented roads projects including the restoration of Makhanda CBD s streets (viz Somerset, High, Hill and New Streets) in Makana Municipality that was completed in March 2022 restoring the pride of the town. DCOG, with the support of MISA, has commenced with the implementation of MIG schedule 6B to accelerate basic service delivery and National Treasury has confirmed that adjustment process for the pioneers, viz uThukela District Municipality and Emfuleni Local Municipality, is underway.
INFRASTRUCTURE ASSET MANAGEMENT AND THE MIG REFORMS Municipalities poor performance on infrastructure asset management is evidenced on unreliable basic services provision and published results like the Green Drop and Blue Drop Reports and the Auditor General s Reports among others. Lack or poor infrastructure asset management leads to service disruptions and at worst catastrophic failures that result in loss of life as well as damage to property. The deployment of built environment professionals through MISA aims to augment municipalities capacity as well as providing technical support in infrastructure management. The rest of the National and Provincial Departments are also supporting municipalities in accordance with section 154 of the Constitution. DCOG, with MISA support, has introduced MIG reforms to support municipalities with infrastructure asset management. Municipalities may utilize up to 5 % of their MIG allocations to fund Infrastructure Asset Management Plan related activities. Furthermore, municipalities that have non-compliance pre-directives or directives with the DWS may spend up to 10 % of their allocations for urgent repair & refurbishment of water & sanitation infrastructure to restore functionality.
INFRASTRUCTURE ASSET MANAGEMENT AND THE MIG REFORMS DWS is tightening regulation on non-compliance. In June 2023 DWS reported that it had issued non-compliance notices to 90 municipalities instructing them to correct the shortcomings identified in the Green Drop Report. DWS has intervened in terms of section 63 of the Water Services Act where WSAs have failed to perform their water services functions e.g. in Emfuleni Municipality, uMkhanyakude District Municipality and Nelson Mandela Bay Metropolitan Municipality (NMBMM). The Section 63 intervention in NMBMM has since been lifted as announced in August 2023. In accordance with the DDM Model, DWS, DCOG, MISA and National Treasury has developed an Action Plan to assist municipalities with worst Blue Drop and Green Drop Results. The Action Plan was tabled and approved by Cabinet on 8 August 2023 and presented to COGTA MinMEC on 30 September 2023. This support is provided for under section 154 of the Constitution. In cases where municipalities have not prioritized restoring infrastructure assets to functionality, unspent MIG funds are considered for MIG 6B implementation where projects have already been identified by DCOG supported by MISA.
MIG PERFORMANCE AND SUPPORT The Department administers the MIG, which is a direct grant to 218 municipalities that provides funding for the development of municipal infrastructure, thus providing a basic level of service to poor communities. Provinces such as KwaZulu/Natal, Mpumalanga, Limpopo and the Western Cape have consistently performed at 90% and above due to effective support and monitoring mechanisms. The Minister issued guidance to the management of DCoG on the steps to be taken to support provinces and municipalities that are performing poorly such as Eastern Cape, Free State, North-West Gauteng and Northern Cape. Performance of the MIG over the last three years (MIG spent on average 89,57% against the allocations over the last 3 FYs) Provincial Performance ovwer the last three financial years Average over 3 years 2020/21 2021/22 2022/23 Prov Expenditure as % of allocation 80.72% 80.11% 69.37% 96.12% 86.31% 98.56% 74.17% 83.18% 93.01% 87.71% Allocated (R'000) Expenditure (R'000) Expenditure as % of allocation Allocated (R'000) Expenditure (R'000) Expenditure as % of allocation Allocated (R'000) Expenditure (R'000) 91.28% 87.27% 69.80% 96.94% 89.16% 98.13% 66.55% 89.70% 94.40% 91.28% 82.65% 79.35% 72.58% 99.39% 92.28% 96.96% 73.36% 81.18% 95.99% 89.73% 84.88% 82.24% 70.58% 97.49% 89.25% 97.88% 71.36% 84.69% 94.47% 89.57% 2,866,318 797,376 349,140 3,158,316 2,977,399 1,698,153 452,552 1,754,813 436,998 2,616,478 695,847 243,684 3,061,794 2,654,691 1,666,397 301,189 1,574,113 412,530 3,150,667 779,352 281,652 3,585,280 3,100,822 1,889,630 472,148 1,878,769 454,428 15,592,748 2,604,123 618,398 204,420 3,563,584 2,861,588 1,832,232 346,371 1,525,171 436,195 3,467,969 788,051 399,940 3,838,843 3,438,109 2,072,800 493,649 1,846,929 495,711 16,842,001 2,799,281 631,308 277,446 3,689,875 2,967,415 2,042,916 366,142 1,536,320 461,062 14,771,765 EC FS GP KZ LP MP NC NW WC TOTAL 14,491,065 13,226,723 13,992,082 25 DISTRICT DEVELOPMENT MODEL
VARIOUS APPROACHES TO MITIGATE STOPPING OF MIG FUNDS 1 3 2 Move funds and adjust Implementation Plans (IPs) to roads maintenance as informed by Vala Zonke Project initiated by DoT (programme to deal with the potholes across the country) Move funding and adjust Implementation Plans (IPs) to repairs and refurbishment projects (existing or new urgent repairs and refurbishment) Move funding and adjust Implementation Plans (IPs) from poor spending projects to projects with opportunity to spend faster 4 5 6 Move funding to schedule 6B and adjusting the allocations and IPs (already applied in 1 perennial poor performing municipality(Emfuleni) and another dysfunctional municipality (uThukela DM) Move funding to District Municipality (dependent on District Performance and Capacity) and adjusting allocations and IPs (already applied in 3 perennial poor performing municipalities in the Free State) Cost reimbursement (Already applied in 10 perennial poor performing municipalities in North- West, KZN, Northern Cape and Eastern Cape) 7 DCoG (together with MISA) to embark on intensive engagements with Provinces and Poor Performing municipalities in those provinces to explore and apply the above instruments to prevent the stopping of MIG funds to municipalities during the 2023/2024 financial year.
FLAGSHIP PROGRAMMES Innovative Solid Waste Management Eastern Seaboard Development (ESD) Through the Presidential Employment Stimulus (PES) programme, MISA was allocated R 284 million to develop and rollout innovative technologies for waste management The project was implemented in 7 provinces across 18 municipalities 15 681 short-term jobs and 141 SMMEs opportunities were created Magnitude of waste were redirected from the landfill and reduction of pollution resulted in fostering sustainable waste management practices Program also introduced value chain markets for the SMMEs business growth Participants initiated their own start-up SMMEs in the collection and reselling of recyclables ESD, a flagship of District Development Model (DDM) project Accelerate socio-economic development and improve the quality of life of the communities Project covers 4 Districts and 17 Local Municipalities and is home to over 3,5 million people. The ESD was gazetted as a region in June 2022, the Regional Spatial Development Framework (RSDF) was developed and being finalised MISA is finalising plans that are critical to serve as a guide for the investments and infrastructure development required in ESD Establishment of the SPV to manage the ESD region is being considered.
MUNICIPAL SUPPORT INTERVENTIONS Supply Chain and Procurement Impact of Intervention MISA has provided support to municipalities on the following areas: Support municipalities with the review of SCM policies for the improvement of infrastructure procurement processes Identification of SCM process gaps/deficiencies and make the necessary recommendation of the Infrastructure Procurement and other SCM interventions Provide advisory services to municipalities on the processes to be undertaken to establish Framework Contracts for more efficient procurement; Hands on support for infrastructure ToR Review Support on PAAP Alignment of the SMC policy with the Framework For infrastructure Delivery and Procurement Management (Circular 106) Advice on the establishment of Framework Contracts to expedite infrastructure delivery Recommendations on the improvement of the ToRs on the procurement of infrastructure as per the CIDB requirements Improvement and compliance with legislative framework and policies (e.g. Circular 106) is evident in municipalities supported Ongoing work will continue to evaluate the impact and further interventions and support required
MUNICIPAL SUPPORT INTERVENTIONS cont Social Labour Plans Financing of infrastructure MISA is providing ongoing support to 14 municipalities with the alignment of the Social Labour Plans (SLPs) and their IDPs The project improve the implementation and financing of municipal infrastructure programs. The alignment has ensured that the SLP approved projects are aligned to municipal IDPs and are implemented by mines MISA collaborated with Centre for Applied Studies (CALS) of Wits University to roll out a SLP training program to capacitate municipal officials MISA has supported municipalities with the technical advice on the Budget Facility for Infrastructure (BFI) BFI is a government reform, introduced to support the development of strategic infrastructure that will contribute towards economic growth 14 municipalities have been supported and 8 have successfully submitted their BFI applications MISA explored Innovative funding mechanisms which use the existing grants allocations to scale up the financing of infrastructure development were explored Private Sector Participation (PSP) model was introduced, and ongoing engagements with to uptake this innovation continues
SUPPORT/INTERVENTIONS TO MAKANA LOCAL MUNICIPALITY EC PROVINCE Municipality Baseline information prior to the intervention/support provided Intervention/Support Provided by MISA/COGTA/Other Sector Department(s) Status /Progress to date Future Actions Makana Local Municipality continuing. Section 154 support Water provision is at 97,7% sanitation at 94,4 % (Source 2023/24). The current financial year s expenditure improved, the RAS sitting at 56% as of October 2023, the municipality stand a chance of receiving additional funding by March 2024. The Municipality has been having limitations provision of basic services for several years, and this has been aggravated by persistent drought, ageing infrastructure, lack of operations maintenance. and A collaborative municipal support intervention has been set up by EC CoGTA and ongoing which includes multisectoral departments includes Department of Transport, Department of Water and Sanitation, Department of Economic Development, Environmental Affairs and Tourism, EC Treasury and Office of the Premier. in the IDP monthly all MIG has ahead and and which MISA, is The pertaining to service delivery in Makhanda is the provision of reliable and sustainable potable water residents, sewer poor effluent quality, poor municipal roads main challenges could to spillages, the Provincial the EC
SUPPORT/INTERVENTIONS TO MAKANA LOCAL MUNICIPALITY EC PROVINCE MISA provides technical support to MLM including the implementation of infrastructure grants MISA through it s own resources implemented a roads rehabilitation project in the Makhanda City that restored Somerset, High, Hill & New Streets for a project cost of R17 830 489,67 (incl. VAT). In total 5000 m2, 3.8 km of roads were upgraded. The project commenced on the 21stof April 2021 & was successfully completed on the 30thof November 2021. The project increased business confidence & brought the former glory of Makhanda central business district (CBD) Department of Water and Sanitation (DWS) Bulk Water Projects (to address water challenges) Project Name Implementing Agent Budget Timeframes Amatola Water Board (WB) R15.2mil July 2023 - March 2024 (31 August 2023 Practical Completion) 1. The augmentation of the existing 10 M /day James Kleynhans WTW by the construction of an additional 10 M /day WTW to 20Ml/day, along with associated works required to meet the bulk potable water needs for the Bulk Water Supply 2. Emergency Repair & refurbish pumpstation @ Howlsons Poort Dam and commission water to Waainek WTW. Provision of Operations & Maintenance for Makana LM for Waainek WTW Amatola WB R534mil Jun 2023- Dec 2023
SUPPORT/INTERVENTIONS TO EMFULENI LOCAL MUNICIPALITY GAUTENG PROVINCE Baseline information prior to the intervention/support provided Intervention/Support Provided by MISA/COGTA/Other Sector Department(s) Status /Progress to date Future Actions Backlogs in waste collection services, aging waste management vehicles and equipment, growing settlements, lack of public awareness on responsible management, poor enforcement of municipal by-laws management and decreasing airspace in landfills. Implementation by MISA of innovative waste management mechanisms to divert waste from landfill and minimise environmental degradation as well as poverty alleviation and unemployment. Implemented Project Budget: R8 098 944.48 Expenditure: R8 098 944.48 Expenditure: 100% Continuous training to innovative solid waste project beneficiaries on Occupational Health and Safety. human Continuation of section 154 support as well as section 63 interventionby DWS solid waste Number of Job Opportunities created: Planned: 500 Actual: 487 on waste Development of SMMEs Planned: 3 Actual: 5
SUPPORT/INTERVENTIONS TO EMFULENI LOCAL MUNICIPALITY GAUTENG PROVINCE Municipality Baseline information prior to the intervention/support provided Intervention/Support Provided by MISA/COGTA/Other Sector Department(s) Status /Progress to date Future Actions Emfuleni Local Municiapality The municipality is dire, which is exacerbated by the following factors: Insufficient attachment of the municipality s bank account by creditors is negatively municipality s operations activities since there is no budget to fund these activities. Material municipality does not have the basic equipment, material, protective wear, and vehicles to conduct its maintenance work. Maintenance municipality is taking on a reactive plan approach in addressing pothole repairs instead of following the activities outlined on their maintenance plan. This is mainly due to budget constraints which forces them to implement what is being prioritised at that moment. External service providers not being paid. The municipality attributes this to the withholding of funds by creditors. state of road infrastructure in the MISA Emfuleni LM under KPI 12 which focuses on the Kilometres of roads maintained to include patching and drainage cleaning in the 22 dysfunctional municipalities. is currently supporting MISA Schedule 6B implementation to ensure service delivery is supporting the MIG budget. The potholes impacting and maintenance the Nelson Mandela Day in 2023, MISA assisted the facilitating and procuring 1500 x 25kg bags of cold mix asphalt and 8 x 200litre drums of emulsion binder. This material is used in the patching of potholes and is assisting the municipality in programme. In commemorating municipality by and equipment. The Plan. The its maintenance supported Emfuleni LM s Business Plan for the Asset Management Plan on Roads and Stormwater. The project is currently on procurement stage (Advertised). MISA reviewed and
SUPPORT/INTERVENTIONS TO EMFULENI LOCAL MUNICIPALITY GAUTENG PROVINCE PROJECT NAME Implement ing Agent Area Budget Timeframes VAAL RIVER SYSTEMS INTERVENTIONS: Rietspruit WWTW Upgrade, Sebokeng WWTW Upgrade, Meyerton WWTW Upgrade, Leeukuil WWTW Upgrade, Mechanical services for the water & wastewater treatment plants and electrical services for 44 pump stations and mechanical services for 44 p/s, Refurbish PS 34, Upgrade PS 34, Refurbish Inlet Works at Rietspruit, Refurbish Inlet Works at Leeuwkuil and Rising Main from PS2 to Leeuwkuil, Vaal River System Intervention (Supervision and Monitoring), 1.3km Gravity main to pump station 2, Critical Collapsed Pipes Replacement, Refurbishment of Critical Pump Stations, Rand Water (O&M), Human Resources (Operations and Maintenance), chemicals, training and skills transfer, maintenance work, Personal Protective Equipment and Unblocking of solids. Sebokeng Meyerton Leeukuil Rietspruit R4.7 billion March 2022 to June 2027 (Designs Complete , Contractors for pumpstation appointed in July 2023) Rand Water
SUPPORT/INTERVENTIONS IN KGETLENGRIVIER MUNICIPALITY NORTH WEST PROVINCE Municipality Baseline information prior to the intervention/support provided Intervention/Support Provided by MISA/COGTA/Other Sector Department(s) Status /Progress to date Future Actions Status of infrastructure - Swartruggens and Koster WWTWs were polluting the water courses because they were not functioning properly that led to the issuing of a non-compliance directive by DWS. Rates Payers association took over the operation. MISA assisted and supported with supervision and monitoring of the refurbishment/upgrading projects, operational inspection of the works and advising on how to improve operations. The plants operation has improved significantly, and the municipality is now in control of the operations. MISA assisted the Municipality in the planning of projects supervision (Cost Re-imbursement) management that expenditure The upgrade of Swartruggens WWTWs was completed. The maintenance of the Sludge Bell- pressers for Koster and repair of chemical dosing equipment. The next Green Drop assessment score is expected to improve. Improve the redundancy in the pumps & motors, chemical dosing equipment and deploy adequate number of operators Kgetlengrivier Infrastructure Grants expenditure was poor at 45% in 2017/18 financial year. 100% MIG expenditure in 2022/23 financial year Ensure more of the MIG funding is spend on repairs and refurbishment. and has project improved Technical Staff: The municipality did not have a Town Planning Department in 2017/18 MISA assisted in the establishing of a functional in 2020/21 financial year and placed a Young assisting with the day-to-day functioning of the department municipality is building capacity. A exists, and Young Misa graduate is deployedto assistwith the functioning functional Planning Department Staffing development of operational procedures to improve operational efficiencies and effectiveness of the Department and Graduate who is whilst the
SUPPORT/INTERVENTIONS TO LEKWA MUNICIPALITY- MPUMALANGA PROVINCE Municipality Baseline information prior to the intervention/support provided Intervention/Support Provided by MISA/COGTA/Other Sector Department(s) Status /Progress to date Future Actions /Requirements Lekwa LM Water: Water: Water: Budget Prioritisation. Propper Planning Project Prioritisation. Master Plan: DBSA is assisting the Municipality to develop the Master Plan. Feasibility studies for water & sanitation have been developed through GSDM and the outline the water & sanitation needs for LLM. Three raw water turbine pumping units installed. One raw water pumping unit refurbished. Two clear water pumping units installed for Kieser. Standerton Bulk WSS: Construction in progress for Kieser Street reservoir and pressure tower. 10% water backlogs Compilation of a master plan to guide long term water and sanitation needs of the Municipality which will include the upgrade of the water treatment facility Compilation of O&M plan Refurbishment of raw water pumping units and installation of clear water pumping units for Kieser pump station in progress Lack of reliable water supply in Lekwa LM villages and farm areas High water losses estimated at 40% as a result of leakages since supply network is largely asbestos pipes. Inadequate Water Storage and distribution. Poor Infrastructure Operations & Maintenance. Upgrading of the Standerton Bulk Water Supply System Incapacitated WTW to meet the demand. Refurbishment/Installation of boreholes in rural/farm areas
SUPPORT/INTERVENTIONS TO LEKWA MUNICIPALITY- MPUMALANGA PROVINCE Municipality Baseline information prior to the intervention/support provided Intervention/Support Provided by MISA/COGTA/Other Sector Department(s) Status /Progress to date Future Actions /Requirements SANITATION: 13% sanitation backlogs. Non-functional stations and sewer spillages. Formed Partnership with Goldi Factory for the installation of three Concor water pumping units and rising main. Refurbishment WTW support programme for address operations maintenance challenges. SANITATION: Upgrade of Rooikoppen sewer network in progress. Refurbishment of sewer pump stations (Vaal, Talijaard, TLC, Johan, Steijn and Muller). To source funds for the upgrade of the Standerton WWTW. ELECTRICITY: Negotiate with ESKOM for the temporal increase of the NMD. Compilation of a master plan to guide long term electrical needs of the Municipality. Installation of quality monitoring equipment boreholes installed & refurbished in the 2021/22 FY throughSASOL SLP. ASTRAL assisted with the installation of 3 water pumping units which have supply in Concor area. Partnership Goldi (100%). Morgenzon WTW is In progress; Phase 1 complete. Seriti assisting with Phase 2 for Standerton WTW. Boreholes: Eight (8) sewer pump of on asset Morgenzon non-lending care aided water Insufficient capacity of Standerton waste-water treatment (WWTW). ELECTRICITY: 9% electricity backlogs Electricity outages exceeding of maximum demand. Lack of reliable electrical supply in Lekwa. to works and with due to Eskom notified SANITATION: Rooikoppen sewer network is in progress through DWS and GSDM using WSIG. Phase 1&4 are at 34% at completion. Phase complete & phase 6 is at 88% completion. Refurbishment sewer pump Talijaard, TLC, Johan, complete Upgrade of Blue and Green Drop Levels: As per the DWS reports for Blue and Green drop, Lekwa Municipality scored as follow: Blue Drop Lekwa LM 45% Green Drop (Cumulative Risk Ratios) Lekwa LM 94,8%. 5 is 100% of stations (Vaal, Stejn) is
DWS SUPPORT TO LEKWA MUNICIPALITY- MPUMALANGA PROVINCE Project Name Implementing Agent Area Budget Timeframe INTERVENTION: - LEKWA Standerton Extension 8 Internal Sewer Reticulation, Repairs / Refurbishment and Unblocking of Rooikoppen 1 and booster pump station3, Upgrading of Rooikoppen internal sewer reticulation Phase 1 & 4 sewer, Unblocking of Sewer Network in Sakhile Ext 6 & 7, Unblocking of Sewer Network in Sakhile Concur Drainage, Unblocking of Sewer Network Standerton CBD Drainage, Water Conservation & Demand Management Conservation & Demand Management in Concur, Water Conservation & Demand Management in Old Standerskop, Rectification of Standerton Ext 8 Water, Refurbishment of Standerton Abstraction, Refurbishment / Repairs of Standerton WTW s, Upgrading of Standerton Sewer Pump Stations (Vaal & Muller), Upgrading of Standerton Sewer Pump Stations (Johan & Steyn), Upgrading of Standerton Sewer Pump Stations ( Taljaard), Upgrading of Pump Stations and Bulk Sewer for Morgenzon, Operation and Maintenance of sewer pump station in Standerton & Morgenzon WATER AND SANITATION SERVICES April 2023 - June 2024 (Booster pumpstation and boreholes complete, 9 projects on construction, 5 projects at procurement stage) in Rooikoppen,, Water Gert Sebande DM Standerton, Morgenzon R350 million
DWS SUPPORT TO METROPOLITAN MUNICIPALITIES (SOURCE: DWS 2023) No. WSA Project Name Implementing Agent Area Budget Milestones 1. Gauteng Metros The Ministerial Intervention in Gauteng Municipalities to address the water crisis that affected Ekurhuleni, City of Johannesburg, Tshwane Metro as well as DMs and LM. Technical Task Team Led by DWS has been put in place and strategic water and sanitation projects and timelines has been set with respective budgets. - Vlakfontein resevors of 210ML/Day completed - Zuikerbotch punpstation to add 150Ml/day completed Rand Water and DWS Gauteng Province Funded by Cities June 2023- July 2028 2. eThekwini Metro Ministerial Intervention to implement projects for purposes of alleviation of sewer spillages in eThekwini Metro. The Initiative entails refurbishment, upgrades, operations and maintenance of 10x WWTW that contribute 90% of the overall effluent treatment in eThekwini Metro. The intervention will improve water and sanitation services, reduce blockages, and water leaks while improving revenue collection. The intervention support will be running for initial 3 years and is further proposed for 20 yr lease agreement. uMgeni Water Ethekwini Funded by City July 2023 to June 2026 (SLA to be Signed on 30 Aug 2023) 3. City of Tshwane Ministerial Intervention Support to address the state of emergency on water and sanitation services in intervention aims to alleviate the effluent discharge from Rooiwal WWTW into the Apies River and subsequent poor portable water quality from Temba WTW. The intervention seeks to refurbish, upgrades and maintain Rooiwal WWTW and Temba WTW. DBSA Hammanskra al R4 bil July 2023 to June 2027 (MOU &S LA finalised) Tswane in Hammanskral. The 4. Mangaung Metro Ministerial Intervention for the implementation and acceleration of the Weldbedacht Bulk Water Scheme Phase 2 to augment and reduce water losses from the bulk water system Bloem Water Mangaung Metro TBC Estimated July 2025 39
HUMAN SETTLEMENTS VLAKKELAND PROJECT SCOPE Development of 2556 housing opportunities. Phase 1 caters for 942 opportunities and Phase 2 for 1614 opportunities at an estimated cost of R453 million; Installation of all required bulk, connector and internal civils and electrical infrastructure; Provision for a range of non-residential sites for social and economic opportunities catering for business, schools (primary and secondary), 2 sports fields, places of worship, public open spaces, playparks, ECD s (Early Childhood Development), a nature reserve area and municipal usage sites. The project caters for a variety of housing options ranging from free BNG houses, affordable FLISP / Social housing opportunities as well as opportunities for Military Veterans; The project provides for different housing typologies including single free standing, double as well as triple row houses, double story semi-detached as well as row units; Beneficiaries are selected in line with the Municipality s Housing Selection and Allocation Policy. 60% is selected from the general waiting list, 20% special needs including people with disabilities and pensioners and 20% allocated to Farm and rural dwellers; Installation of all required bulk, connector and internal civil & electrical infrastructure; The construction of the Strawberry King Bulk water pipeline funded by the Municipal Infrastructure Grant (MIG) and the Municipality resulted in the unlocking of this development.
FLAGSHIP PROJECTS VLAKKELAND PROJECT STATUS Phase one consisting of 942 of the 2556 opportunities have been fully serviced; Of the 942 opportunities, 432 houses have been completed and 323 under construction; 182 job opportunities to date; R248 million spent. VLAKKELAND PROJECT RISKS Bulk Services (especially electricity) funding to unlock for Phase 2; and Relocation of Small-Scale Farmers encroaching onto the development.
PROGRESS PER PILLAR PILLAR 3 - GOOD GOVERNANCE
POLITICAL STABILITY Hung Councils 2000-2021 LGE The first local government elections (LGEs) produced 29 hung councils. This increased to 31 (including the City of Cape Town) in the 2006 LGEs, before peaking to 37 hung councils in the 2011 elections. The 2016 LGEs produced the least (27) hung councils. 2021 LGE resulted in 81 hung councils 2021 LGE 2016 LGE 2011 LGE It is common knowledge that hung councils carry the potential for a more robust political contestation between parties in the chamber, stalemates in decision making, walk-outs and general instability. 2006 LGE 2000 LGE 0 10 20 30 40 50 60 70 80 90 21(26%) out of 81 hung councils are categorised as dysfunctional municipalities 43
GOOD GOVERNANCE FUNCTIONALITY OF OVERSIGHT STRUCTURES DCoG, Provinces and Salga have done a lot of training and capacity building for oversight structures in municipalities, not just in dysfunctional municipalities. However, there are cases where these structures remain challenged. The support has not stopped, it is ongoing, and with regards to MPAC, it has been intensified. No. of Provinces Council ExCo / MayCo MPAC Audit Comm Municipalities Functional Dysfunctional Functional Dysfunctional Functional Dysfunctional Functional Dysfunctional Eastern Cape 10 1 11 - 10 1 10 1 11 Free State 10 1 10 1 5 6 7 4 11 Gauteng 11 - 11 - 11 - 10 1 11 KwaZulu Natal 9 3 8 4 8 4 10 2 12 Limpopo 3 - 3 - 3 - 3 - 3 Mpumalanga 6 - 6 - 6 - 6 - 6 North-West 7 1 7 1 5 3 5 3 8 Northern Cape 9 - 8 1 8 1 6 3 9 Western Cape 2 - 2 - 2 - 2 - 2 44
MOVEMENT OF THE AUDIT OUTCOMES DYSFUNCTIONAL MUNICIPALITIES Unqualified with findings Qualified Adverse Disclaimer Outstanding 2021/ 2022 2020/ 2021 2019/ 2020 2021/ 2022 2020/ 2021 2019/ 2020 2021/ 2022 2020/ 2021 2019/ 2020 2021/ 2022 2020/ 2021 2019/ 2020 EC 1 1 1 7 6 5 1 1 2 2 3 3 FS 2 2 2 5 6 6 0 0 0 2 3 3 2 GP 0 1 1 1 0 1 0 1 0 1 0 0 KZN 2 2 1 8 7 6 1 0 1 1 3 4 LIM 0 1 1 3 2 1 0 0 1 0 0 0 MP 1 1 0 4 2 1 0 0 1 1 3 4 NC 1 0 0 6 7 5 0 0 0 2 2 4 NW 1 1 0 4 4 4 0 0 0 4 5 6 1 WC 0 0 0 1 2 1 0 0 0 1 0 1 TOTAL 8 9 6 39 36 30 2 2 5 14 19 25 3 10 municipalities managed to improve their audit opinions while seven regressed. The was also marked reduction in the number of municipalities that obtained adverse/disclaimer of opinion from 30 in 2019/2020 to 16 in 2021/2022. The audits in three municipalities (Kopanong, Masilonyana (FS) and Ditsobotla (NW)) are still outstanding due to late submission of the AFS. 45
PROGRESS PER PILLAR PILLAR 4 - FINANCIAL MANAGEMENT
SUSTAINABILITY RATIOS IN NON-DELEGATED MUNICIPALITIES In terms of the 2011 statistics, almost 45% of the population of the country lived in the following 17 municipalities. These figures will change with the new census. This highlights the importance of ensuring that these seven municipalities function optimally. The financial indicators will show progress but also where there is still some work to do going forward. OR Tambo Nelson Mandela By Polokwane Mbombela Buffalo City Current ratio (This ratio measures the city s ability to repay its short-term liabilities with its short-term assets. The norm ranges from a ratio of 1.9 to 2.4. The higher the ratio, the more unlikely the city will be able to repay current or short-term obligations) 1.1 (within the norm) 2.1 (within the norm) 0.24 (below the norm) 0.7 (below the norm) 1.2 (within the norm) Cost Coverage - This ratio indicates the city's ability to meet its monthly fixed operating commitments from cash and short-term investments without collecting any additional revenue, during that month. The norm of 1 to 3 months. 5 months (above the norm) 3 months (within the norm) unknown 1.9 months (within the norm) 0.3 months (below the norm) Repairs & Maintenance The National Treasury Norm (Cir 71) is 8% of PPE 1% 3.8% 5.9% 6.1% 5.3% Collection rate - The Ratio indicates the percentage of revenue collection; i.e. level of payments. It measures increases or decreases in Debtors relative to annual billed revenue. The norm is 95 per cent 68.1% 80.57% 79.5% 89.4% 79% Budget The budget is unfunded if the municipality is likely to spend more than what it projected to collect Unfunded Funded Unfunded Funded Funded Funding Mix (Capital Budget) 11% Own Funding 89% Grants 31% Own Funding 69% Grants 23% Own Funding 77% Grants 29.4% Own Funding 70.6% Grants 38.1% Own Funding 61.9% Grants 47
SUSTAINABILITY RATIOS IN NON-DELEGATED MUNICIPALITIES cont Ekurhuleni Metro George Mafikeng Tshwane Sol Plaatjie Current ratio (This ratio measures the city s ability to repay its short-term liabilities with its short-term assets. The norm ranges from a ratio of 1.9 to 2.4. The higher the ratio, the more unlikely the city will be able to repay current or short-term obligations) 1.2 (within the norm) 2.1 (within the norm) 0.8 (within the norm) Unknown (data strings not credible) 0.9 (below the norm) Cost Coverage - This ratio indicates the city's ability to meet its monthly fixed operating commitments from cash and short-term investments without collecting any additional revenue, during that month. The norm of 1 to 3 months. 0.7 months (below the norm) 3 months (within the norm) 0.25 months (below the norm) Unknown (data strings not credible) Less than 1 month (below the norm) Repairs & Maintenance The National Treasury Norm (Cir 71) is 8% of PPE 4% 5% 3.1% 2.1% 14% Collection rate - The Ratio indicates the percentage of revenue collection; i.e. level of payments. It measures increases or decreases in Debtors relative to annual billed revenue. The norm is 95 per cent 90% 96% 79.5% 95% 74.3% Budget The budget is unfunded if the municipality is likely to spend more than what it projected to collect Unfunded Funded Unfunded Unfunded Unfunded Funding Mix (Capital Budget) 14% Own Funding 86% Grants 61% Own Funding (Incl. borrowing) 39% Grants & Borrowings 33.6% Own Funding 66.4% Grants 12% Own Funding 88% Grants 29% Own Funding 71% Grants 48
SUSTAINABILITY RATIOS IN NON-DELEGATED MUNICIPALITIES cont Johannesburg Metro Rustenburg Cape Town Mangaung Umhlathuze Current ratio (This ratio measures the city s ability to repay its short-term liabilities with its short-term assets. The norm ranges from a ratio of 1.9 to 2.4. The higher the ratio, the more unlikely the city will be able to repay current or short-term obligations) 1.1 (within the norm) 1.1 (within the norm) 1.4 (within the norm) 1.1 (within the norm) 1.5 (within the norm) Cost Coverage - This ratio indicates the city's ability to meet its monthly fixed operating commitments from cash and short-term investments without collecting any additional revenue, during that month. The norm of 1 to 3 months. 4 months (above the norm) 4.5 months (above the norm) 3.2 months (above the norm) Below 0 months (below the norm) 2.1 months (within the norm) Repairs & Maintenance The National Treasury Norm (Cir 71) is 8% of PPE 6.8% Below 8% 8.6% 2.7% 6.1% Collection rate - The Ratio indicates the percentage of revenue collection; i.e. level of payments. It measures increases or decreases in Debtors relative to annual billed revenue. The norm is 95 per cent 90% 85% 95.74% 74.7% 98% Budget The budget is unfunded if the municipality is likely to spend more than what it projected to collect Unfunded Unfunded Funded Unfunded Funded Funding Mix (Capital Budget) 55% Own Funding 45% Grants 17.5% Own Funding 82.5% Grants 74.5% Own Funding(Incl. borrowing) 25.5% Grants 21% Own Funding 79% Grants 71.5% Own Funding (Incl. borrowing) 28.5% Grants 49
SUSTAINABILITY RATIOS IN NON-DELEGATED MUNICIPALITIES cont Msunduzi Ethekwini Metro Current ratio (This ratio measures the city s ability to repay its short-term liabilities with its short-term assets. The norm ranges from a ratio of 1.9 to 2.4. The higher the ratio, the more unlikely the city will be able to repay current or short-term obligations) 1.1 (within the norm) Less than 1 (below the norm) Cost Coverage - This ratio indicates the city's ability to meet its monthly fixed operating commitments from cash and short-term investments without collecting any additional revenue, during that month. The norm of 1 to 3 months. 0.75 months (below the norm) 3 months (within the norm) Repairs & Maintenance The National Treasury Norm (Cir 71) is 8% of PPE 7% 6.2% Collection rate - The Ratio indicates the percentage of revenue collection; i.e. level of payments. It measures increases or decreases in Debtors relative to annual billed revenue. The norm is 95 per cent 91% 88% Budget The budget is unfunded if the municipality is likely to spend more than what it projected to collect Unfunded Funded Funding Mix (Capital Budget) 50.2% Own Funding (Incl. borrowing) 49.8% Grants 41.7% Own Funding (Incl. borrowing) 58.3% Grants 50
