Progress and Reforms in Juvenile Justice Systems
Explore the significant progress and reforms in juvenile justice systems, focusing on the reduction of confinement rates in various states, the overhaul of the Texas juvenile justice system, and the challenges with high rearrest rates for youth under supervision. Discover the initiatives taken and outcomes achieved in reshaping juvenile justice approaches.

Download Presentation

Please find below an Image/Link to download the presentation.
The content on the website is provided AS IS for your information and personal use only. It may not be sold, licensed, or shared on other websites without obtaining consent from the author. If you encounter any issues during the download, it is possible that the publisher has removed the file from their server.
You are allowed to download the files provided on this website for personal or commercial use, subject to the condition that they are used lawfully. All files are the property of their respective owners.
The content on the website is provided AS IS for your information and personal use only. It may not be sold, licensed, or shared on other websites without obtaining consent from the author.
E N D
Presentation Transcript
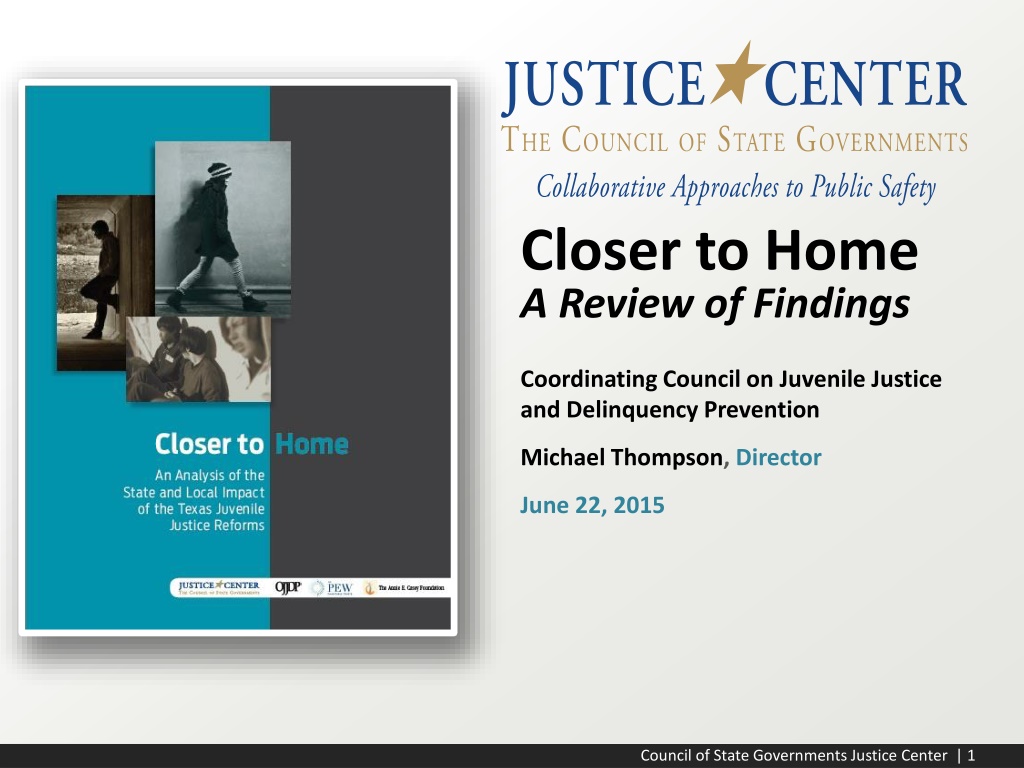
Closer to Home A Review of Findings Coordinating Council on Juvenile Justice and Delinquency Prevention Michael Thompson, Director June 22, 2015 Council of State Governments Justice Center | 1
States dramatic progress in reducing confinement rates PERCENT CHANGE IN STATE COMMITMENT RATES (1997-2011) 100% 80% 60% New Hampshire 40% Massachusetts North Carolina South Carolina United States South Dakota Pennsylvania Rhode Island New Mexico Washington Connecticut New Jersey Mississippi Minnesota Tennessee Oklahoma Wisconsin New York Maryland Wyoming California Delaware Louisiana Montana Michigan Kentucky Colorado Arkansas Vermont Alabama Missouri Georgia Arizona Virginia Nevada Indiana Oregon 20% Florida Kansas Hawaii Illinois Alaska Maine Texas Utah Iowa Ohio 0% Idaho West Virginia Nebraska North Dakota -20% -40% -60% Estimated In-School Suspensions Nationally Estimated Out-of-School Suspensions Nationally -80% -100% *Office of Juvenile Justice and Delinquency Prevention, Easy Access to the Census of Juveniles in Residential Placement. Available at ojjdp.gov/ojstatbb/ezacjrp Council of State Governments Justice Center | 2
Texas juvenile justice system overhauled REFORM HIGHLIGHTS and AVERAGE DAILY POPULATION IN STATE-SECURE JUVENILE FACILITIES 6,000 2011 LEGISLATURE Merged former Texas Youth Commission and Texas Juvenile Probation Commission to form Texas Juvenile Justice Department (TJJD) 5,000 2013 LEGISLATURE Mandated TJJD to close one additional state-run secure facility; $25 million designated for community mental health services 2007 LEGISLATURE Prohibited commitment to state-run secure facilities for misdemeanor offenses; age of state jurisdiction reduced from 21 to 19; $60 million in new funding for 4,000 3,000 counties 2,000 2009 LEGISLATURE $45 million for Commitment Reduction Program, with incentive funding for counties and community supervision 1,000 0 2002 2003 2004 2005 2006 2007 2008 2009 2010 2011 2012 2013 Council of State Governments Justice Center | 3
High rearrest rates for youth under juvenile justice supervision in Texas REARREST RATE FOR YOUTH ON PROBATION AND RELEASED FROM STATE- RUN SECURE FACILITIES, ONE, THREE AND FIVE YEAR RATE 90% 85% 77% 80% 75% 70% 64% 60% 50% 44% Rearrest Rate for Youth on Probation 40% 35% Rearrest Rate for Youth Released from State-run Secure Facilities 30% 20% 10% 0% One-Year Rate (2012 Group) Three-Year Rate (2010 Group) Five-Year Rate (2008 Group) Council of State Governments Justice Center | 4
Texas state leaders asked: What impact did the reforms have? Request: Funding: Partners: Council of State Governments Justice Center | 5
Dramatic decrease in the number of youth in state- run juvenile correctional facilities after 2007 reforms 5,000 25.0 % Change 4,500 22.5 FY04- 06 FY07- 14 4,000 20.0 AVERAGE ADP 3,500 17.5 3,000 15.0 -2% -70% 2,500 12.5 2,000 10.0 1,500 7.5 1,000 5.0 500 2.5 0 0.0 2004 2005 2006 2007 2008 2009 2010 2011 2012 2013 2014 AVERAGE ADP TOTAL ADMISSIONS Council of State Governments Justice Center | 6
Proportionate decline in commitments cross white, Hispanic, and African-American youth DISPOSITIONS RESULTING IN COMMITMENT TO STATE SECURE FACILITIES BY RACE 5.5% 4.7% 4.5% 3.4% 3.5% Black 3.0% Hispanic 2.6% 2.3% 2.5% White 2.0% 1.7% 1.5% 1.5% 1.2% 0.5% 2005 2008 2012 Council of State Governments Justice Center | 7
Juvenile arrests in Texas dropped while number of youth incarcerated declined JUVENILE ARREST RATE (PER 100,000 POPULATION) 2000-2012 FOR TEXAS, FLORIDA, AND CALIFORNIA 1,000 900 Florida 800 700 California 600 500 Texas 400 300 200 100 0 2000 2002 2004 2006 2008 2010 2012 Source for juvenile population: www.ojjdp.gov, Easy Access to Juvenile Populations: 1990-2013 Council of State Governments Justice Center | 8
Youth on probation less likely to be rearrested than youth with nearly identical characteristics released from state-run secure facilities First One Year Probability of Rearrest Recidivism Offense a Felony YOUTH RELEASED FROM STATE-RUN SECURE FACILITIES 49% 41% YOUTH 17% 34% SUPERVISED IN THE COMMUNITY Youth released from state- run secure facilities were 3x more likely to commit a felony when recidivating Youth released from state- run secure facilities were 21% more likely to rearrested Council of State Governments Justice Center | 9
Per capita funding for juvenile probation increased significantly after reforms FY2005 FY2012 % Change Per capita expenditures for local juvenile probation departments $3,555 $7,023 98% Council of State Governments Justice Center | 10
After reforms, rearrest rates did not improve and were comparable for all interventions PRE-REFORM STUDY GROUP One Year Probability of Rearrest POST-REFORM STUDY GROUP One Year Probability of Rearrest State Incarceration 41% 41% Skill-Based Program 29% 27% Treatment Program 28% 30% 31% Surveillance Program 29% 33% Secure County Placement 34% 35% 35% Non-Secure County Placement 32% 33% No Intervention Council of State Governments Justice Center | 11
Expected recidivism rates compared to actual recidivism rates EXPECTED ACTUAL REARREST RATE REARREST RATE Tarrant 36% 46% Travis 37% 44% HIGHER 30% 40% Victoria Harris 37% 39% AS EXPECTED Lubbock 33% 33% Cameron 34% 28% Dallas 31% 27% LOWER El Paso 32% 28% Council of State Governments Justice Center | 12
Key Takeaways for Texas 1. Texas has reduced the number of youth incarcerated in its state- run secure facilities without compromising public safety. 2. Youth supervised closer to home have lower rearrest rates than similar youth released from state-run secure facilities. 3. The state has invested some of the hundreds of millions saved, which resulted from the closure of eight state-run secure facilities, in community-based supervision and services. 4. Recidivism rates for youth under community supervision have not improved since the reforms. Texas is not realizing the full potential of its investment in community based supervision and services Council of State Governments Justice Center | 13
Report released Jan. 29, 2015 at TX Supreme Court Council of State Governments Justice Center | 14
Legislation passed in response to report findings Report Finding: Youth released from state-run secure facilities were 21% more likely to rearrested Texas SB 1630: Further limits the commitment of youth to state secure facilities Requires juvenile departments to develop regionalization plans to keep youth closer to home Council of State Governments Justice Center | 15
Legislation passed in response to report findings Report Finding: Gaps in use of best practice have kept Texas from realizing the full potential of their investment in community interventions Texas SB 1630: Requires the development of research- based programs for youth in the community and those committed Establishes performance based goals and ties funding to these goals Creates a new TJJD division responsible for monitoring program quality and accountability Council of State Governments Justice Center | 16
DOJ can help states and counties to: 1. Take a hard look at impact of reforms they have enacted 1. Minimize incarceration of youth in state correctional facilities 2. Improve outcomes for youth under community-based supervision Council of State Governments Justice Center | 17
Thank You FULL REPORT AT: http://csgjusticecenter.org/youth/publications/closer-to-home/ HOME PAGE AT: http://csgjusticecenter.org The presentation was developed by members of the Council of State Governments Justice Center staff. The statements made reflect the views of the authors, and should not be considered the official position of the Justice Center, the members of the Council of State Governments, or the funding agency supporting the work. Citations available for statistics presented in preceding slides available on CSG Justice Center web site. Council of State Governments Justice Center | 18