Process Mapping for Quality Improvement
A process map is a graphical representation of a series of steps in a process, essential for understanding, identifying problem areas, and improving efficiency in service delivery. Process mapping visually represents work processes and aids in gaining organizational support for change.
Download Presentation

Please find below an Image/Link to download the presentation.
The content on the website is provided AS IS for your information and personal use only. It may not be sold, licensed, or shared on other websites without obtaining consent from the author.If you encounter any issues during the download, it is possible that the publisher has removed the file from their server.
You are allowed to download the files provided on this website for personal or commercial use, subject to the condition that they are used lawfully. All files are the property of their respective owners.
The content on the website is provided AS IS for your information and personal use only. It may not be sold, licensed, or shared on other websites without obtaining consent from the author.
E N D
Presentation Transcript
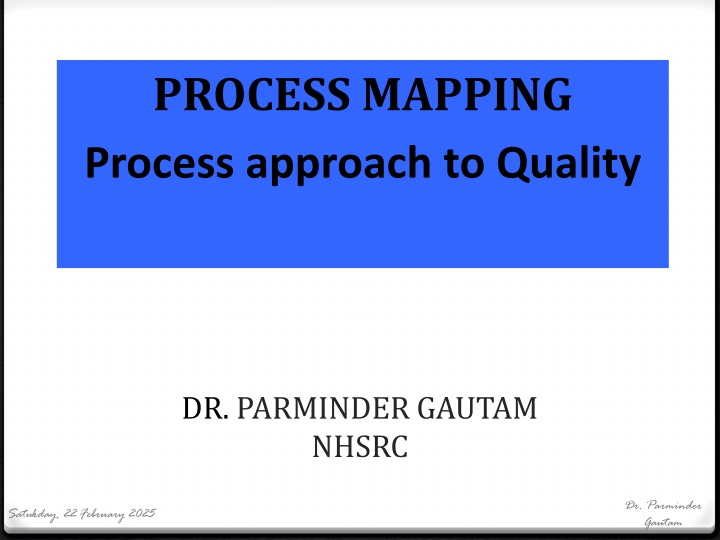
PROCESS MAPPING Process approach to Quality DR. PARMINDER GAUTAM NHSRC Dr. Parminder Gautam Saturday, 22 February 2025 1
Donabedians Model of Quality of Care Outcome Process Structure
Input Process Output Pre- Post- Analytical Analytical Analytical Output Process Input 22-02-2025 QI-NHSRC Delhi 3
WHAT IS A PROCESS A process is a set of interrelated or interacting activities which transforms inputs into outputs A process is defined as a series of steps which convert one or more inputs into one or more outputs. Saturday, 22 February 2025 Dr. Parminder Gautam 4
What is a process map ? 0 Graphical representation of the series of steps of a process 0 A pictorial representation of the sequence of actions that comprise a process. 0 It traces the flow of physical product and information through the steps 0 If there is no physical product, the map is used to document the step-by-step activities involved in providing a service Saturday, 22 February 2025 Dr. Parminder Gautam 5
Why process mapping ? Saturday, 22 February 2025 Dr. Parminder Gautam 6
Why Process Mapping? 0 Visually represents the work process 0 Before you can improve a process, you must understand it. 0 Provides a common understanding of the entire process and specific roles and contributions of process participants. 0 Identifies problem areas and opportunities for process improvement 0 Process maps are a great problem solving tool 0 Helps us determine what is the problem/what it is not 0 You don t learn to Process Map, You Process Map to learn. (Dr.Myron Tribus) Saturday, 22 February 2025 Dr. Parminder Gautam 7
Why Process Mapping 0 Increase efficiency 0 Eliminate non-value-added activities 0 Reduce cycle time 0 Expand service capabilities 0 Simplify work flow 0 Minimize dependencies 0 Gain buy-in and organizational support for change Saturday, 22 February 2025 Dr. Parminder Gautam 8
Why is Process Mapping Important? 0It provides an opportunity to learn about work that is being performed. 0Dr. Myron Tribus said You don t learn to Process Map, You Process Map to learn. 0Most processes today are undocumented. Saturday, February 22, 2025 Dr. Parminder Gautam NHSRC 9
Looking at patient processes 030 - 70% of work doesn t add value for patient 0up to 50% of process steps involve a hand- off , leading to error, duplication or delay 0 no one is accountable for the patient s end to end experience 0job roles tend to be narrow and fragmented Saturday, 22 February 2025 Dr. Parminder Gautam 10
Symbols used to Process Map 0 Start & End: An oval is used to show the materials, information or action (inputs) to start the process or to show the results at the end (output) of the process. 0 Activity: A box or rectangle is used to show a task or activity performed in the process. Although multiple arrows may come into each box, usually only one arrow leaves each box. 0 Decision: A diamond shows those points in the process where a yes/no question is being asked or a decision is required. 0 Break: A circle with either a letter or a number identifies a break in the process map and is continued elsewhere on the same page or another page. Saturday, 22 February 2025 Dr. Parminder Gautam 11
Important Points 0 Process Map what is, not what you would like the process to be. 0 Process Mapping is dynamic. Use Post-it notes, dry erase markers, pencil, etc. 0 All Process Maps must have start and stop points. Saturday, 22 February 2025 Dr. Parminder Gautam 12
Compiling a Process Map Name of the person completing task + verb Who does what and when? Saturday, 22 February 2025 Dr. Parminder Gautam 13
Process Bottlenecks occurs when a step is the limiting rate of the process The step takes a significant time, and slows the whole process down. Saturday, 22 February 2025 Dr. Parminder Gautam 14
FUNCTIONAL BOTTLENECK Saturday, 22 February 2025 Dr. Parminder Gautam 15
VALUE / NON-VALUE ADDING STEPS Value adding The activity transforms the patient and moves them towards the next defined outcome The activity is something that the patient cares about Non-value adding Do not serve any purpose (aim to remove these) Necessary non-value adding Do not directly benefit patient but are necessary e.g. completion of forms, logging patient details onto systems, numerous checks of details Saturday, 22 February 2025 Dr. Parminder Gautam 16
Value-added Task 0It is done right the first time with no waste or rework. 0It is value-added or it is waste (non-value added) Saturday, 22 February 2025 Dr. Parminder Gautam 17
WASTE IS A SENSITIVE ISSUE 0Its critical to eliminate waste 0Its also critical to recognise that the non value adding activities may have been a core part of someone job for many years 0It s the activities that are non value adding not the person Saturday, 22 February 2025 Dr. Parminder Gautam 18
Wastes in Hospitals (MUDAS) 01. confusion 02. Motion/conveyance. 03. waiting 04. over processing 05. inventory. 06. defects 07. over production. Saturday, 22 February 2025 Dr. Parminder Gautam 19
Wastes in Hospitals (MUDAS) 0 1. Confusion: 0 Nurses spend 65% of their time looking for things they could not find, clarifying unclear instructions and doing redundant paperwork. (Jimmerson et al. 2005). Confusion includes questions like: 0 What do I do with this requisition? 0 What does this order mean? 0 Where do I have to store this item? Saturday, 22 February 2025 Dr. Parminder Gautam 20
Wastes in Hospitals (MUDAS) 0 2. Motion/conveyance: 0 Physical movement required to get a simple task done and to move people from place to place. 0 Redundant reaching for items. 0 Walking to another location only to return to the starting point. 0 Conveyance of patients and materials from room to room or department to department. Saturday, 22 February 2025 Dr. Parminder Gautam 21
Wastes in Hospitals (MUDAS) 0 3. waiting: 0 Waiting for : 0 a procedure to be done, 0 a medication to arrive, 0 or a doctor s order to be given. Saturday, 22 February 2025 Dr. Parminder Gautam 22
Wastes in Hospitals (MUDAS) 0 4. over processing: 0 Doing more activities than is necessary to complete a work. 0 Multiple entries of patient s demographic details during the hospital visit. Saturday, 22 February 2025 Dr. Parminder Gautam 23
Wastes in Hospitals (MUDAS) 0 5. Inventory: 0 Stored supply that are: 0 Obsolete. 0 Duplicated. 0 Unnecessary. 0 Missed charges for items used. Saturday, 22 February 2025 Dr. Parminder Gautam 24
Wastes in Hospitals (MUDAS) 0 6. defects: 0 Medication errors. 0 Wrong site surgery. 0 Leaving instruments in patient s body. 0 Wrong blood group errors. 0 Bed sores. 0 Incidence of fall from bed. Saturday, 22 February 2025 Dr. Parminder Gautam 25
Wastes in Hospitals (MUDAS) 7. Over Production: Doing more work than necessary. Redundant Paper work. (Waste of patient time, possibility of error, ) Saturday, 22 February 2025 Dr. Parminder Gautam 26
Analysing the process map How many steps in your process? How many duplications? How many hand-offs? What is the approximate time of or between each step? Where are possible delays? Where are major bottlenecks? How many steps do not add value for patients? How many types of wastes are there between each step? Where are the problems for patients and staff? Saturday, 22 February 2025 Dr. Parminder Gautam 27
Remember always aim to Add value Remove waste Saturday, 22 February 2025 Dr. Parminder Gautam 28
Basic Process Redesign Techniques 0Eliminate non-value-added activities 0Eliminate duplicate activities 0Combine related activities 0Identify and remove waste at each step. 0Process in parallel 0Use decision-based, alternative process flow paths Saturday, 22 February 2025 Dr. Parminder Gautam 29
Process mapping facts 0 Process mapping is basic and simple the best way to learn it is to do it! 0 Process mapping is a repetitive process, maps should never be thrown away but reviewed and updated. 0 Display the maps so all staff can see them and contribute to ongoing improvements Saturday, 22 February 2025 Dr. Parminder Gautam 30
What gets Measured Gets Focused What gets Focused Gets Improved What gets improved Gets Appreciated " If the world were perfect, it wouldn't be Yogi Berra Gets Institutionalized What gets Appreciated Thank You
