Probability Scenarios for Monitoring Variable Changes
Explore various probability scenarios when observing substantial increases, decreases, or unclear changes in a monitored variable based on the true value, smallest important change, and standard error of the change. Understand the likelihood of different outcomes and how to calculate probabilities for potential shifts in the variable.
Uploaded on Dec 16, 2024 | 3 Views
Download Presentation

Please find below an Image/Link to download the presentation.
The content on the website is provided AS IS for your information and personal use only. It may not be sold, licensed, or shared on other websites without obtaining consent from the author.If you encounter any issues during the download, it is possible that the publisher has removed the file from their server.
You are allowed to download the files provided on this website for personal or commercial use, subject to the condition that they are used lawfully. All files are the property of their respective owners.
The content on the website is provided AS IS for your information and personal use only. It may not be sold, licensed, or shared on other websites without obtaining consent from the author.
E N D
Presentation Transcript
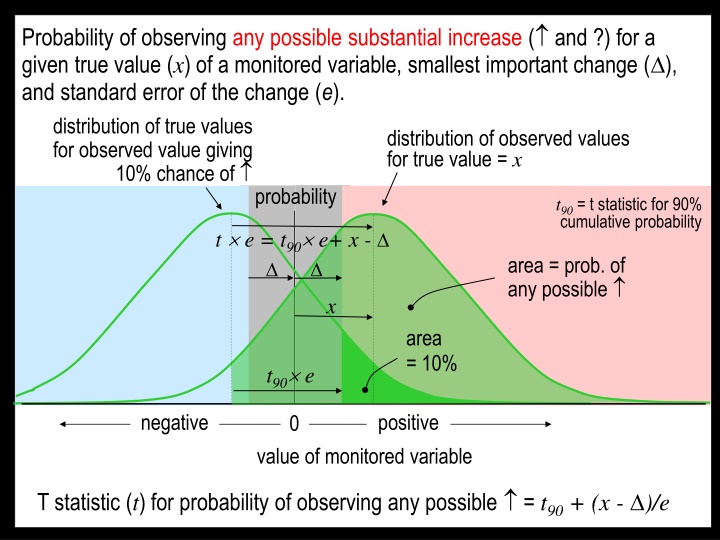
Probability of observing any possible substantial increase ( and ?) for a given true value (x) of a monitored variable, smallest important change ( ), and standard error of the change (e). distribution of true values for observed value giving 10% chance of probability distribution of observed values for true value = x t90 = t statistic for 90% cumulative probability t e = t90 e+ x - area = prob. of any possible x area = 10% t90 e negative positive 0 value of monitored variable T statistic (t) for probability of observing any possible = t90 + (x - )/e
Probability of observing any possible substantial decrease ( and ?) for a given true value (x) of a monitored variable, smallest important change ( ), and standard error of the change (e). distribution of true values for observed value giving 10% chance of probability distribution of observed values for true value = x t90 = t statistic for 90% cumulative probability t e = x + - t90 e area = prob. of any possible x area = 10% t90 e negative positive 0 value of monitored variable T statistic (t) for probability of observing any possible = -((x + )/e t90)
Probability of observing an unclear change (?) is given by: probability of any increase minus probability of a clear increase = probability of any increase minus probability of not any decrease = probability of any increase minus (100 minus probability of any decrease). If the resulting probability is negative, set it to zero (no unclear changes). distribution of observed values for true value = x probability area = prob. of ? negative positive 0 value of monitored variable The same probability would be obtained by considering the probability of any decrease minus the probability of a clear decrease.
Probability of observing a very likely increase () for a given true value (x) of a monitored variable, smallest important change ( ), and standard error of the change (e). distribution of true values for observed value giving 90% chance of t90 = t statistic for 90% cumulative probability distribution of observed values for true value = x probability t e = t90 e+ - x area = prob. of x area = 10% t90 e negative positive 0 value of monitored variable T statistic (t) for probability of observing = -(t90 + ( - x)/e)
Probability of observing a very likely decrease () for a given true value (x) of a monitored variable, smallest important change ( ), and standard error of the change (e). distribution of true values for observed value giving 90% chance of distribution of observed values for true value = x probability t90 = t statistic for 90% cumulative probability t e+ + x = t90 e area = prob. of x area = 10% t90 e negative positive 0 value of monitored variable T statistic (t) for probability of observing = -(t90 + ( + x)/e)
