Probability in Game Development

Probability
IMGD 2905
Overview
Statistics
 important for game analysis
Probability
 important for statistics
So, understand some 
basic probability
Also, 
probability
 useful for game development
Groupwork
What are some examples of probabilities
needed for game development?
Provide a specific example
Icebreaker, Groupwork, Questions
https://web.cs.wpi.edu/~imgd2905/d22/groupwork/5-
probabilities/handout.html
Overview
Statistics
 important for
game analysis
Probability
 important
for statistics
So, understand some
basic probability
Also, 
probability
 itself
useful for game
development
Probabilities for game
development?
Examples?
Overview
Statistics
 important for
game analysis
Probability
 important
for statistics
So, understand some
basic probability
Also, 
probability
 itself
useful for game
development
Probabilities for game
development?
Probability attack will
succeed
Probability loot from enemy
contains rare item
Probability enemy spawns
at particular time
Probability action (e.g.,
building a castle) takes
particular amount of time
Probability players at server
Outline
Introduction
    
(
done
)
Probability
    
(
next
)
Probability Distributions
Probability Definitions (1 of 3)
Probability
 – way of assigning
numbers to outcomes to express
likelihood of event
Event
 – outcome of experiment
or observation
Elementary
 – simplest type for
given experiment. independent
Joint/Compound 
– more than one
elementary
 
Roll die 
(d6) and get 6
elementary event
Roll die (
d6) and get even number
compound event, consists of
elementary events 2, 4, and 6
Pick card 
from standard deck and
get queen of spades
elementary event
Pick card 
from standard deck and
get face card
compound event
Observe players logging in 
to
MMO server and see if two
people log in less than 15
minutes apart
compound event
We’ll treat/compute probabilities of
elementary versus compound separately
Probability – Definitions (2 of 3)
Exhaustive set of events
– set of all possible
outcomes of
experiment/observation
Mutually exclusive sets
of events 
– elementary
events that do not
overlap
Roll d6:  
Events: 1, 2
not exhaustive, mutually
exclusive
 
Roll d6:  
Events: 1, 2, 3, 4, 5, 6
exhaustive, mutually exclusive
Roll d6
: Events: get even
number, get number divisible by
3, get a 1 or get a 5
exhaustive, but overlap
Observe logins: 
time between
arrivals <10 seconds, 10+  and
<15 seconds inclusive, or 15+
seconds
exhaustive, mutually exclusive
Observe logins
: time between
arrivals <10 seconds, 10+  and
<15 seconds inclusive, or 10+
seconds
exhaustive, but overlap
Probability – Definitions
(3 of 3)
 
Probability
 – likelihood of event to occur,
 
ratio of favorable cases 
to 
all cases
Set of rules that probabilities must follow
Probabilities must be 
between 0 and 1 
(but often written/said as
percent
)
Probabilities of set of 
exhaustive
, 
mutually exclusive 
events must
add up to 1
e.g., d6: events 1, 2, 3, 4, 5, 6.  Probability of 1/6
th
  to each,
sum of P(1) + P(2) + P(3) + P(4) + P(5) + P(6) = 1
 
legal set of probabilities
e.g., d6: events 1, 2, 3, 4, 5, 6. Probability of ½ to roll 1, ½ to
roll 2, and 0 to all the others sum of P(1) + … + P(6) = 0.5 + 0.5
+ 0 … + 0 = 1
 Also legal set of probabilities
Not how honest d6’s behave in real life!
Q: 
how to assign
probabilities?
How to Assign Probabilities?
Q: 
how to assign probabilities?
Assigning Probabilities
 
Classical 
(by theory)
In some cases, exhaustive, mutually exclusive outcomes
equally likely 
 assign each outcome probability of 
1/n
e.g., 
d6
: 1/6, 
Coin
: prob heads ½, tails ½, 
Cards
: pick Ace 1/13
Empirically
 (by observation)
Obtain data through measuring/observing
e.g., Watch how often people play PUBG in FL222 versus
some other game.  Say, 30% PUBG.  Assign that as probability
Subjective
 (by hunch)
Based on expert opinion or other subjective method
e.g., eSports writer says probability Fnatic (European LoL
team) will win World Championship is 25%
Rules About Probabilities (1 of 2)
 
Complement:  
A
 an event. Event “Probability 
A
does not occur” called 
complement 
of 
A
,
denoted A’
P(A’) 
= 1 - P(A)
 
 
Why?
e.g., d6: P(6) = 1/6, complement is
 P(6’) 
and
probability of “not 6” is 1-1/6, or 5/6.
Note: Value often denoted 
p
, complement is 
q
Mutually exclusive:
 
Have no simple outcomes in
common – can’t both occur in same experiment
P(A or B) 
=
 P(A) 
+
 P(B)
“Probability either occurs”
e.g., d6: P(3 or 6) = P(3) + P(6) = 1/6 + 1/6 = 2/6
Rules About Probabilities (2 of 2)
 
Independent: 
 Probability that one occurs doesn’t affect
probability that other occurs
e.g., 2d6: A= die 1 get 5, B= die 2 gets 6. Independent, since
result of one roll doesn’t affect roll of other
“Probability both occur” 
  
P(A and B) = P(A) x P(B)
e.g., 2d6: prob of “snake eyes” is P(1) x P(1) = 1/6 x 1/6 = 1/36
Not independent: 
One occurs affects probability that other
occurs
Probability both occur 
  
P(A and B) = P(A) x P(B | A)
Where P(B | A) means prob B given A happened
e.g., PUBG chance of getting top 10 is 10%.  Chance of using
only stock gun 50%.  You might think that:
P(top 10) x P(stock) = 0.10 x 0.50  = 0.05
But likely 
not
 independent. P(top | stock) < 5%.  So, need non-
independent formula
P(top) * P(top | stock)
(Card example next slide)
Probability Example
Probability drawing King?
Probability Example
Probability drawing King?
P(K) = ¼
Draw, put back. Now?
Probability Example
Probability drawing King?
P(K) = ¼
Draw, put back. Now?
 P(K) = ¼
Probability 
not
 King?
Probability Example
Probability drawing King?
P(K) = ¼
Draw, put back. Now?
 P(K) = ¼
Probability 
not
 King?
P(K’) = 1-P(K) = ¾
Draw, put back. 2 Kings?
Probability Example
Probability drawing King?
P(K) = ¼
Draw, put back. Now?
 P(K) = ¼
Probability 
not
 King?
P(K’) = 1-P(K) = ¾
Draw, put back. Draw. 2
Kings?
P(K) x P(K) = ¼ x ¼ = 1/16
Draw.  King or Queen?
Probability Example
Probability drawing King?
P(K) = ¼
Draw, put back. Now?
 P(K) = ¼
Probability 
not
 King?
P(K’) = 1-P(K) = ¾
Draw, put back. Draw. 2
Kings?
P(K) x P(K) = ¼ x ¼ = 1/16
Draw.  King or Queen?
P(K or Q) = P(K) + P(Q)
= ¼ + ¼ = ½
Probability Example
Probability drawing King?
P(K) = ¼
Draw, put back. Now?
 P(K) = ¼
Probability 
not
 King?
P(K’) = 1-P(K) = ¾
Draw, put back. Draw. 2
Kings?
P(K) x P(K) = ¼ x ¼ = 1/16
Draw.  King or Queen?
P(K or Q) = P(K) + P(Q)
= ¼ + ¼ = ½
Draw, put back.  Draw.
Not King either card?
Probability Example
Probability drawing King?
P(K) = ¼
Draw, put back. Now?
 P(K) = ¼
Probability 
not
 King?
P(K’) = 1-P(K) = ¾
Draw, put back. Draw. 2
Kings?
P(K) x P(K) = ¼ x ¼ = 1/16
Draw.  King or Queen?
P(K or Q) = P(K) + P(Q)
= ¼ + ¼ = ½
Draw, put back.  Draw.
Not King either card?
P(K’) x P(K’) = ¾ x ¾ = 9/16
Draw, 
don’t
 put back.
Draw. Not King either
card?
Probability Example
Probability drawing King?
P(K) = ¼
Draw, put back. Now?
 P(K) = ¼
Probability 
not
 King?
P(K’) = 1-P(K) = ¾
Draw, put back. 2 Kings?
P(K) x P(K) = ¼ x ¼ = 1/16
Draw.  King or Queen?
P(K or Q) = P(K) + P(Q)
= ¼ + ¼ = ½
Draw, put back.  Draw.
Not King either card?
P(K’) x P(K’) = ¾ x ¾ = 9/16
Draw, 
don’t
 put back.
Draw. Not King either
card?
P(K’) x P(K’ | K’) = ¾ x (1-1/3)
 = 
¾  x 2/3
= 6/12 = ½
Draw, don’t put back.
Draw.  King 2
nd
 card?
P(K’) x P(K | K’) = ¾ x ⅓ = 3/12 = ¼
Outline
Intro
     
(
done
)
Probability
    
(
done
)
Probability Distributions
  
(
next
)
Probability Distributions
Probability distribution 
values and likelihood
(expected value) that
random variable can take
Why? If can model
mathematically, can use to
predict occurrences
e.g., probability slot machine
pays out on given day
e.g., probability game server
hosts player today
e.g., probability certain game
mode is chosen by player
Also, some statistical
techniques for some
distributions only
Types discussed:
Uniform
 (discrete)
Binomial
 (discrete)
Poisson
 (discrete) 
Normal
 (continuous)
Remember empirical rule?
What distribution did it apply to?
Uniform Distribution
 
“So what?”
Can use known
formulas
Uniform Distribution
 
“So what?”
Can use known
formulas
Mean      = (1 + 6) / 2 = 3.5
Variance = ((6 – 1 + 1)
2
 – 1)/12 
                 = 2.9
 Std Dev  = sqrt(Variance) = 1.7
Note – mean is also the 
expected value
(
if you did a lot of trials, would be average result
)
Binomial Distribution Example (1 of 3)
Suppose toss 3 coins
Random variable
X
 = number of heads
Want to know probability
of 
exactly
 2 heads
P(
X
=2) = ?
How to assign probabilities?
Binomial Distribution Example (1 of 3)
Suppose toss 3 coins
Random variable
X
 = number of heads
Want to know probability
of 
exactly
 2 heads
P(
X
=2) = ?
How to assign probabilities?
Could 
measure 
(
empirical
)
Q: how?
Could use “hunch”
(
subjective
)
Q: what do you think?
Could use theory
(
classical
)
Math using our probability
rules (not shown)
Enumerate (next)
 
All equally likely (
p
 is 1/8 for each)
 
P(HHT) + P(HTH) + P(THH) = 
3/8
Can draw histogram
of number of heads
Binomial Distribution Example (2 of 3)
http://www.mathnstuff.com/math/spoken/here/2class/90/binom2.gif
 
Binomial Distribution Example (3 of 3)
These are 
all
 binomial distributions
( 
Pascal's
Triangle
)
Binomial Distribution (1 of 2)
In general, any number of
trials (
n
) & any probability
of successful outcome (
p
)
(e.g., heads)
 
Characteristics of experiment
that gives random number
with binomial distribution:
Experiment of 
n
 identical trials.
Trials are independent
Each trial only two possible
outcomes, 
Success
 or 
Fail
Probability of 
Success
 each trial
is same, denoted 
p
Random variable of interest (
X
)
is number of 
Successes
 in 
n
 trials
 
Binomial Distribution (2 of 2)
“So what?”
Can use known formulas
http://www.s-cool.co.uk/gifs/a-mat-sdisc-dia12.gif
 
http://www.s-cool.co.uk/gifs/a-mat-sdisc-dia08.gif
 
Binomial Distribution Example
Each row is like a coin
flip
right = “heads”
left = “tails”
Bottom axis is number
of heads
Gives and “empirical”
way to estimate P(X)
bin(X) 
÷
sum(bin(0) + bin(1) + …)
https://www.mathsisfun.com/data/quincunx.html
Poisson Distribution
 
Distribution of probability of 
x
 
events occurring in
certain interval
 (broken into units)
Interval can be time, area, volume, distance
e.g., number of players arriving at server lobby in 5-
minute period between noon-1pm
Requires
1.
Probability of event 
same
 for all time units
2.
Number of events in one time unit 
independent
 of
number of events in any other time unit
3.
Events occur 
singly
 (not simultaneously).  In other
words, as interval unit gets smaller, probability of
two events occurring approaches 0
 
 
Poisson Distributions?
Not Poisson
 
Number of people arriving at
restaurant during dinner hour
People frequently arrive in
groups
Number of students
registering for course in
Workday
 per hour on first day
of registration
Prob not equal – most register in
first few hours
Not independent – if too many
register early, system crashes
Could Be Poisson
 
Number of groups arriving
at restaurant during dinner
hour
Number of logins to MMO
during prime time
Number of defects (bugs)
per 100 lines of code
People arriving at cash
register (if they shop
individually)
Phrase people use is
random arrivals
Poisson Distribution
Distribution of probability of 
x
 
events
occurring in certain interval
http://www.dummies.com/education/math/business-statistics/how-to-compute-poisson-probabilities/
Poisson Distribution Example
1.
Number of games student plays per day
averages 
1
 per day
2.
Number of games played per day independent
of all other days
3.
Can only play one game at a time
What’s probability of playing 
2
 games tomorrow?
In this case, the value of 
λ
 = 1
, want 
P(X=2)
Current Poisson Distribution Example
New England city
Average new COVID-19
cases 
50
/day
Local hospital has 
60
 free
beds
What is the probability
more than 60 
in one day?
https://stattrek.com/online-calculator/poisson.aspx
= 
???
Q: How do we get greater than 60?
P(0) + P(1) + … + P(60) 
 P(≤60)
P(>60) = 1 = P(≤ 60)
Current Poisson Distribution Example
New England city
Average new COVID-19
cases 
50
/day
Local hospital has 
60
 free
beds
What is the probability
more than 60
 in one day?
https://stattrek.com/online-calculator/poisson.aspx
60
= 
???
60
50
Q: How do we get greater than 60?
P(0) + P(1) + … + P(60) 
 P(≤60)
P(>60) = 1 = P(≤ 60)
https://stattrek.com/online-calculator/poisson.aspx
Current Poisson Distribution Example
New England city
Average new COVID-19
cases 
50
/day
Local hospital has 
60
 free
beds
What is the probability
more than 60 
in one day?
https://stattrek.com/online-calculator/poisson.aspx
60
= 
0.02
60
50
Q: 
How do we get greater than 60?
P(0) + P(1) + … + P(60) 
 P(≤60)
P(>60) = 1 = P(≤ 60)
Current Poisson Distribution Example
New England city
Average new COVID-19
cases 
50
/day
Local hospital has 
60
 free
beds
What is the probability
more than 60
 in one day?
https://stattrek.com/online-calculator/poisson.aspx
60
= 
0.02
60
50
Q
: How do we get greater than 60?
P(0) + P(1) + … + P(
60
) 
 P(≤60)
P(
>60
) = 1 - P(≤ 60)
Poisson Distribution
“So what?” 
 Known formulas
Mean      = 
λ
Variance = 
λ
Std Dev   = sqrt (
λ
)
e.g., Games 
 m
ay want to
know likelihood of 1.5x average
people arriving at server
Expected Value – Formulation
Expected value 
of discrete random variable is
value you’d 
expect
 after many experimental
trials.  i.e., mean value of population
  
Value
:
  
x
1
 
x
2
 
x
3
 
 
x
n
  Probability
:
 
P(x
1
)
 
P(x
2
)
 
P(x
3
)
 
 
P(x
n
)
Compute by multiplying each 
value
 by
probability
 and summing
μ
x
 = 
E(X) 
= 
x
1
P(x
1
) + x
2
P(x
2
) + … + x
n
P(x
n
)
     = 
Σ 
x
i
P(
x
i
)
Expected Value Example –
Gambling  Game
Pay 
$3 
to enter
Roll 1d6 
 
6
?  Get 
$7
   1-5?  Get 
$1
What is 
expected
 
payoff
? Expected 
net
?
 
Outcome
   
Payoff
         
P(x) 
  
xP(x)
 
1-5
  
$1
  
5/6
 
$5/6
 
 
6
  
$7
  
1/6
 
$7/6
 
E(x) 
= $5/6 + $7/6 = $12/6 = $2 
E(net) 
=
 E(x) 
- $3 = $2 - $3 = 0
Expected Value Example –
Gambling  Game
Pay 
$3 
to enter
Roll 1d6 
 
6
?  Get 
$7   
1-5?  Get 
$1
What is 
expected
 
payoff
? Expected 
net
?
 
Outcome
   
Payoff
         
P(x) 
  
xP(x)
 
1-5
  
$1
  
5/6
 
$5/6
 
 
6
  
$7
  
1/6
 
$7/6
 
E(X) 
= $5/6 + $7/6 = $12/6 = $2 
E(net) 
=
 E(x) 
- $3 = $2 - $3 = 0
E(net) 
=
 E(X) 
- $3 = $2 - $3 = 
$-1
Expected Value Example –
Gambling  Game
Pay 
$3 
to enter
Roll 1d6 
 
6
?  Get 
$7   
1-5?  Get 
$1
What is 
expected
 
payoff
? 
Expected net
?
 
Outcome
   
Payoff
         
P(x) 
  
xP(x)
 
1-5
  
$1
  
5/6
 
$5/6
 
 
6
  
$7
  
1/6
 
$7/6
 
E(X) 
= $5/6 + $7/6 = $12/6 = 
$2
 
Expected Value Example –
Gambling  Game
Pay 
$3 
to enter
Roll 1d6 
 
6
?  Get 
$7
   1-5?  Get 
$1
What is 
expected
 
payoff
? 
Expected net
?
 
Outcome
   
Payoff
         
P(x) 
  
xP(x)
 
1-5
  
$1
  
5/6
 
$5/6
 
 
6
  
$7
  
1/6
 
$7/6
 
E(X) 
= $5/6 + $7/6 = $12/6 = 
$2 
E(net) 
=
 E(X) 
- $3 = $2 - $3 = 
$-1
Outline
Intro
     
(
done
)
Probability
    
(
done
)
Probability Distributions
  
Discrete
  
(
done
)
So far random variable could take only 
discrete
 set
of values
Q: 
What does that mean?
Q: 
What
 other 
distributions might we consider?
Outline
Intro
     
(
done
)
Probability
    
(
done
)
Probability Distributions
  
Discrete
  
(
done
)
Continuous
  
(
next
)
Continuous Distributions
 
Many random variables are
continuous
e.g., recording 
time
 (time to
perform service) or measuring
something (
height
, 
weight
,
strength
)
For continuous, doesn’t
make sense to talk about
P(X=x)  
 
continuum of
possible values for 
X
Mathematically, if all non-zero,
total probability infinite (this
violates our rule)
 
So, continuous distributions
have probability density, 
f(x)
 
How to use to calculate
probabilities?
Don’t care about specific
values
e.g., 
P(Height = 60.1946728163
inches)
Instead, ask about 
range
 
of
values
e.g., 
P(
59.5” 
< X < 
60.5”
)
Uses calculus (integrate area
under curve) (not shown here)
Q: 
What continuous distribution is 
especially
 important? 
 the
 Normal Distribution
 
Normal Distribution (1 of 2)
“Bell-shaped” or “Bell-curve”
Distribution from -∞ to +∞
Symmetric
Mean
, 
median
, 
mode
 all
same
Mean determines location,
standard deviation determines
“width”
Super important!
Lots of distributions follow a
normal curve
Basis for inferential statistics
(e.g., statistical tests)
“Bridge” between probability
and statistics
Aka “Gaussian” distribution
Normal Distribution (2 of 2)
 
Many
 normal distributions
(see right)
However, “the” normal
distribution refers to
standard normal
Mean (
μ
) = 0
Standard deviation (
σ
)  = 1
Can 
convert
 any normal to
the standard normal
Given sample 
mean
 (x̅)
Sample 
standard dev
. (s)
(Next)
green
 - mean -3, std dev 0.5
    red
 - mean 0, std dev 1
 black - mean 2, std dev 3
Many
 normal distributions
 
  
??? 
 
  ??? 
  ??? 
Standard Normal Distribution
Standardize
Subtract sample 
mean 
(x̅)
Divide by sample 
standard
deviation 
(s)
Mean
 
μ
 = 0
Standard Deviation 
σ
 = 1
Total area under curve = 1
Sounds like probability!
 
Use to 
predict how
likely
 an 
observed
sample
 is given
population mean
(next)
Remember the
 Z-score?
 
=norm.dist()
http://ci.columbia.edu/ci/premba_test/c0331/s6/s6_4.html
 
Using the Standard Normal
 
Suppose 
League of
Legends
 Champion
released once every 
24
days
 on average,
standard deviation of 
3
days
What is the probability
Champion released 
30+
days
?
x
 = 
30
, x̅ = 
24
, s = 
3
 
      Z = (
x 
- 
) / s
         = (
30
 - 
24
) / 
3
         = 2
Want to know P(Z > 2)
Q: 
how?  
Hint: 
what rule might help?
Empirical Rule
. Or use table (Z-table)
 5% / 2 = 2.5% likely
http://ci.columbia.edu/ci/premba_test/c0331/s6/s6_4.html
 
Using the Standard Normal
Suppose 
League of
Legends 
Champion
released once every 
24
days
 on average,
standard deviation of 
3
days
What is the probability
Champion released 
30+
days
?
x
 = 
30
, x̅ = 
24
, s = 
3
      Z = (
x
 - 
) / s
         = (
30
 - 
24
) / 
3
         = 2
Want to know P(Z > 2)
=norm.dist(x,mean,stddev,cumulative) 
=norm.dist(2,0,1,false)
Test for Normality
 
Why?
Can use 
Empirical Rule
Use some inferential statistics (parametric tests)
How?
1.
Measure skewness (
next
)
2.
Looks normal
Histogram
Normal probability plot 
(QQ plot) – graphical technique to
see if data set is approximately normally distributed
3.
Statistical test
Kolmogorov-Smirnov test (K-S) or Shapiro-Wilk (S-W) that
compare to normal (won’t do, but ideas in next slide deck)
Measuring Skewness
 
Measure of symmetry of
distribution
Normal is perfectly
symmetric, skewness 0
Easy equations:
Skewness Examples
Normality Testing with a Histogram
Use histogram shape to look for “
bell curve
Yes
No
Normality Testing with a Histogram
Q: 
What distributions are these from?  Any 
normal
?
Normality Testing with a Histogram
They are 
all
 from 
normal distribution
!  Suffer from:
-
Binning
 (not continuous)
-
Few samples 
(15)
Normality Testing with a Quantile-
Quantile Plot
Percentiles
(quantiles) of one
versus another
If line 
 same
distribution
1.
Order data
2.
Compute Z
scores (
normal
)
3.
Plot data (y-
axis) versus Z (x-
axis)
Normal?
 
 line
Quantile-Quantile Plot Example
Do the following values come from a normal
distribution?
7.19, 6.31, 5.89, 4.5, 3.77, 4.25, 5.19, 5.79, 6.79
1.
Order data
2.
Compute Z scores
3.
Plot data versus Z
http://www.statisticshowto.com/q-q-plots/
Show each
step, next
Quantile-Quantile Plot Example –
Order Data
Unordered
7.19
6.31
5.89
4.50
3.77
4.25
5.19
5.79
6.79
Ordered (low to high)
3.77
4.25
4.50
5.19
5.89
5.79
6.31
6.79
7.19
http://www.statisticshowto.com/q-q-plots/
N = 9 
data points
Quantile-Quantile Plot Example –
Compute Z scores
http://www.statisticshowto.com/q-q-plots/
Divide into
N+1 = 10
10% = ?
20% = ?
30% = ?
40% = ?
50% = 0
60% = ?
70% = ?
80% = ?
90% = ?
Lookup in Z-table
Want Z-score for that
segment
Z-Table
10% = -1.28
20% = -0.84
30% = -0.52
40% = -0.25
50% = 0
60% = 0.25
70% = 0.52
80% 
= 
0.84
90% = 1.28
e.g., 80%?
Tells what cumulative percentage of the standard normal
curve is under any point (Z-score).  Or,  
P(-
to Z)
(Note: Above for positive Z-scores –
also negative tables, or diff from 50%)
=NORMSINV(area) 
– provide Z for
area under standard normal curve
=NORMSINV(.80)
=0.841621
Find closest value in table
to desired percent
Quantile-Quantile Plot Example –
Compute Z scores
10% = -1.28
20% = -0.84
30% = -0.52
40% = -0.25
50% = 0
60% = 0.25
70% = 0.52
80% = 0.84
90% = 1.28
(Only some points shown)
Quantile-Quantile Plot Example – Plot
http://www.statisticshowto.com/q-q-plots/
Quantile-Quantile Plots in Excel
Mostly, a manual process.  Do as per above.
Example of step by step process (with spreadsheet):
http://facweb.cs.depaul.edu/cmiller/it223/normQuant.html
Examples of Normality Testing with a
Quantile-Quantile Plot
Slide Note
Embed
Share

Exploring the significance of probability in game development, the content discusses basic probability concepts, examples of probabilities needed for game development, and specific scenarios like the likelihood of successful attacks, rare loot drops, enemy spawns, and time taken for actions. The article delves into elementary and compound events, exhaustive sets, and mutually exclusive events in probability calculations for gaming.

  • Probability
  • Game Development
  • Statistics
  • Probability Concepts
  • Elementariness

Uploaded on Sep 19, 2024 | 0 Views


Download Presentation

Please find below an Image/Link to download the presentation.

The content on the website is provided AS IS for your information and personal use only. It may not be sold, licensed, or shared on other websites without obtaining consent from the author. Download presentation by click this link. If you encounter any issues during the download, it is possible that the publisher has removed the file from their server.

E N D

Presentation Transcript


  1. IMGD 2905 Probability Chapters 4 & 5

  2. Overview Statistics important for game analysis Probability important for statistics So, understand some basic probability Also, probability useful for game development https://www.mathsisfun.com/data/images/probability -line.svg

  3. Groupwork https://www.mathsisfun.com/data /images/probability-line.svg What are some examples of probabilities needed for game development? Provide a specific example Icebreaker, Groupwork, Questions https://web.cs.wpi.edu/~imgd2905/d22/groupwork/5- probabilities/handout.html

  4. Overview Probabilities for game development? Examples? Statistics important for game analysis Probability important for statistics So, understand some basic probability Also, probability itself useful for game development

  5. Overview Probabilities for game development? Probability attack will succeed Probability loot from enemy contains rare item Probability enemy spawns at particular time Probability action (e.g., building a castle) takes particular amount of time Probability players at server Statistics important for game analysis Probability important for statistics So, understand some basic probability Also, probability itself useful for game development

  6. Outline Introduction Probability Probability Distributions (done) (next)

  7. Probability Definitions (1 of 3) Probability way of assigning numbers to outcomes to express likelihood of event Event outcome of experiment or observation Elementary simplest type for given experiment. independent Joint/Compound more than one elementary Roll die (d6) and get 6 elementary event Roll die (d6) and get even number compound event, consists of elementary events 2, 4, and 6 Pick card from standard deck and get queen of spades elementary event Pick card from standard deck and get face card compound event Observe players logging in to MMO server and see if two people log in less than 15 minutes apart compound event We ll treat/compute probabilities of elementary versus compound separately https://cdn.kastatic.org/googleusercontent/Z0TuLq2KolavsrfDXSbLqi0S- wnlCrC13cKGG68wK9ljrTiXzRqvfq7IpWNzcwgzlpEOI8YmMafp4K4zO0sanvXu

  8. Probability Definitions (2 of 3) Exhaustive set of events set of all possible outcomes of experiment/observation Mutually exclusive sets of events elementary events that do not overlap Roll d6: Events: 1, 2 not exhaustive, mutually exclusive Roll d6: Events: 1, 2, 3, 4, 5, 6 exhaustive, mutually exclusive Roll d6: Events: get even number, get number divisible by 3, get a 1 or get a 5 exhaustive, but overlap Observe logins: time between arrivals <10 seconds, 10+ and <15 seconds inclusive, or 15+ seconds exhaustive, mutually exclusive Observe logins: time between arrivals <10 seconds, 10+ and <15 seconds inclusive, or 10+ seconds exhaustive, but overlap

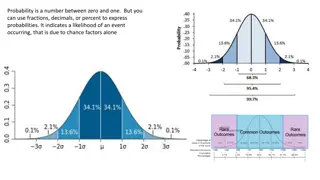
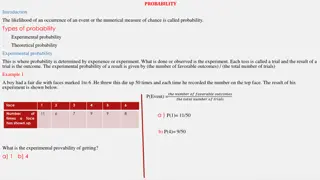
  9. Probability Definitions (3 of 3) Probability likelihood of event to occur, ratio of favorable cases to all cases Set of rules that probabilities must follow Probabilities must be between 0 and 1 (but often written/said as percent) Probabilities of set of exhaustive, mutually exclusive events must add up to 1 e.g., d6: events 1, 2, 3, 4, 5, 6. Probability of 1/6th to each, sum of P(1) + P(2) + P(3) + P(4) + P(5) + P(6) = 1 legal set of probabilities e.g., d6: events 1, 2, 3, 4, 5, 6. Probability of to roll 1, to roll 2, and 0 to all the others sum of P(1) + + P(6) = 0.5 + 0.5 + 0 + 0 = 1 Also legal set of probabilities Not how honest d6 s behave in real life! https://goo.gl/iy3YGr Q: how to assign probabilities?

  10. How to Assign Probabilities? http://static1.squarespace.com/static/5a14961cf14aa1f245bc39 42/5a1c5e8d8165f542d6db3b0e/5acecc7f03ce64b9a46d99c6/1 529981982981/Michael+Jordan+%2833%29.png?format=1500w https://newvitruvian.com/images/marbles-clipart-bag-marble-4.png Q: how to assign probabilities?

  11. Assigning Probabilities Classical (by theory) In some cases, exhaustive, mutually exclusive outcomes equally likely assign each outcome probability of 1/n e.g., d6: 1/6, Coin: prob heads , tails , Cards: pick Ace 1/13 Empirically (by observation) Obtain data through measuring/observing e.g., Watch how often people play PUBG in FL222 versus some other game. Say, 30% PUBG. Assign that as probability Subjective (by hunch) Based on expert opinion or other subjective method e.g., eSports writer says probability Fnatic (European LoL team) will win World Championship is 25%

  12. Rules About Probabilities (1 of 2) Complement: A an event. Event Probability A does not occur called complement of A, denoted A P(A ) = 1 - P(A) Why? e.g., d6: P(6) = 1/6, complement is P(6 ) and probability of not 6 is 1-1/6, or 5/6. Note: Value often denoted p, complement is q Mutually exclusive:Have no simple outcomes in common can t both occur in same experiment P(A or B) = P(A) + P(B) Probability either occurs e.g., d6: P(3 or 6) = P(3) + P(6) = 1/6 + 1/6 = 2/6

  13. Rules About Probabilities (2 of 2) Independent: Probability that one occurs doesn t affect probability that other occurs e.g., 2d6: A= die 1 get 5, B= die 2 gets 6. Independent, since result of one roll doesn t affect roll of other Probability both occur e.g., 2d6: prob of snake eyes is P(1) x P(1) = 1/6 x 1/6 = 1/36 Not independent: One occurs affects probability that other occurs Probability both occur Where P(B | A) means prob B given A happened e.g., PUBG chance of getting top 10 is 10%. Chance of using only stock gun 50%. You might think that: P(top 10) x P(stock) = 0.10 x 0.50 = 0.05 But likely not independent. P(top | stock) < 5%. So, need non- independent formula P(top) * P(top | stock) P(A and B) = P(A) x P(B) P(A and B) = P(A) x P(B | A) (Card example next slide)

  14. Probability Example Probability drawing King?

  15. Probability Example Probability drawing King? P(K) = Draw, put back. Now?

  16. Probability Example Probability drawing King? P(K) = Draw, put back. Now? P(K) = Probability not King?

  17. Probability Example Probability drawing King? P(K) = Draw, put back. Now? P(K) = Probability not King? P(K ) = 1-P(K) = Draw, put back. 2 Kings?

  18. Probability Example Draw. King or Queen? Probability drawing King? P(K) = Draw, put back. Now? P(K) = Probability not King? P(K ) = 1-P(K) = Draw, put back. Draw. 2 Kings? P(K) x P(K) = x = 1/16

  19. Probability Example Draw. King or Queen? P(K or Q) = P(K) + P(Q) = + = Probability drawing King? P(K) = Draw, put back. Now? P(K) = Probability not King? P(K ) = 1-P(K) = Draw, put back. Draw. 2 Kings? P(K) x P(K) = x = 1/16

  20. Probability Example Draw. King or Queen? P(K or Q) = P(K) + P(Q) = + = Draw, put back. Draw. Not King either card? Probability drawing King? P(K) = Draw, put back. Now? P(K) = Probability not King? P(K ) = 1-P(K) = Draw, put back. Draw. 2 Kings? P(K) x P(K) = x = 1/16

  21. Probability Example Draw. King or Queen? P(K or Q) = P(K) + P(Q) = + = Draw, put back. Draw. Not King either card? P(K ) x P(K ) = x = 9/16 Draw, don t put back. Draw. Not King either card? Probability drawing King? P(K) = Draw, put back. Now? P(K) = Probability not King? P(K ) = 1-P(K) = Draw, put back. Draw. 2 Kings? P(K) x P(K) = x = 1/16

  22. Probability Example Draw. King or Queen? P(K or Q) = P(K) + P(Q) = + = Draw, put back. Draw. Not King either card? P(K ) x P(K ) = x = 9/16 Draw, don t put back. Draw. Not King either card? P(K ) x P(K | K ) = x (1-1/3) = x 2/3 = 6/12 = Draw, don t put back. Draw. King 2nd card? Probability drawing King? P(K) = Draw, put back. Now? P(K) = Probability not King? P(K ) = 1-P(K) = Draw, put back. 2 Kings? P(K) x P(K) = x = 1/16

  23. Probability Example Draw. King or Queen? P(K or Q) = P(K) + P(Q) = + = Draw, put back. Draw. Not King either card? P(K ) x P(K ) = x = 9/16 Draw, don t put back. Draw. Not King either card? P(K ) x P(K | K ) = x (1-1/3) = x 2/3 = 6/12 = Draw, don t put back. Draw. King 2nd card? P(K ) x P(K | K ) = x = 3/12 = Probability drawing King? P(K) = Draw, put back. Now? P(K) = Probability not King? P(K ) = 1-P(K) = Draw, put back. 2 Kings? P(K) x P(K) = x = 1/16

  24. Outline Intro Probability Probability Distributions (done) (done) (next)

  25. Probability Distributions Probability distribution values and likelihood (expected value) that random variable can take Why? If can model mathematically, can use to predict occurrences e.g., probability slot machine pays out on given day e.g., probability game server hosts player today e.g., probability certain game mode is chosen by player Also, some statistical techniques for some distributions only https://goo.gl/jqomFI Types discussed: Uniform (discrete) Binomial (discrete) Poisson (discrete) Normal (continuous) Remember empirical rule? What distribution did it apply to?

  26. Uniform Distribution So what? Can use known formulas

  27. Uniform Distribution So what? Can use known formulas Mean = (1 + 6) / 2 = 3.5 Variance = ((6 1 + 1)2 1)/12 = 2.9 Std Dev = sqrt(Variance) = 1.7 Note mean is also the expected value (if you did a lot of trials, would be average result)

  28. Binomial Distribution Example (1 of 3) How to assign probabilities? Suppose toss 3 coins Random variable X = number of heads Want to know probability of exactly 2 heads P(X=2) = ?

  29. Binomial Distribution Example (1 of 3) How to assign probabilities? Could measure (empirical) Q: how? Could use hunch (subjective) Q: what do you think? Could use theory (classical) Math using our probability rules (not shown) Enumerate (next) Suppose toss 3 coins Random variable X = number of heads Want to know probability of exactly 2 heads P(X=2) = ?

  30. Binomial Distribution Example (2 of 3) http://web.mnstate.edu/peil/MDEV102/U3/S25/Cartesian3.PNG All equally likely (p is 1/8 for each) P(HHT) + P(HTH) + P(THH) = 3/8 Can draw histogram of number of heads

  31. Binomial Distribution Example (3 of 3) http://www.mathnstuff.com/math/spoken/here/2class/90/binom2.gif ( Pascal's Triangle) These are all binomial distributions

  32. Binomial Distribution (1 of 2) In general, any number of trials (n) & any probability of successful outcome (p) (e.g., heads) Characteristics of experiment that gives random number with binomial distribution: Experiment of n identical trials. Trials are independent Each trial only two possible outcomes, Success or Fail Probability of Success each trial is same, denoted p Random variable of interest (X) is number of Successes in n trials http://www.vassarstats.net/textbook/f0603.gif

  33. Binomial Distribution (2 of 2) So what? Can use known formulas http://www.s-cool.co.uk/gifs/a-mat-sdisc-dia08.gif Excel: binom.dist() binom.dist(x,trials,prob,cumulative) 2 heads, 3 flips, coin, discrete =binom.dist(2, 3, 0.5, FALSE) =0.375 (i.e., 3/8) http://www.s-cool.co.uk/gifs/a-mat-sdisc-dia12.gif If true ?

  34. Binomial Distribution Example Each row is like a coin flip right = heads left = tails Bottom axis is number of heads Gives and empirical way to estimate P(X) bin(X) sum(bin(0) + bin(1) + ) https://www.mathsisfun.com/data/quincunx.html

  35. Poisson Distribution Distribution of probability of x events occurring in certain interval (broken into units) Interval can be time, area, volume, distance e.g., number of players arriving at server lobby in 5- minute period between noon-1pm Requires 1. Probability of event same for all time units 2. Number of events in one time unit independent of number of events in any other time unit 3. Events occur singly (not simultaneously). In other words, as interval unit gets smaller, probability of two events occurring approaches 0

  36. Poisson Distributions? Not Poisson Number of people arriving at restaurant during dinner hour People frequently arrive in groups Number of students registering for course in Workday per hour on first day of registration Prob not equal most register in first few hours Not independent if too many register early, system crashes Could Be Poisson Number of groups arriving at restaurant during dinner hour Number of logins to MMO during prime time Number of defects (bugs) per 100 lines of code People arriving at cash register (if they shop individually) https://tinyurl.com/3xbaht9c Phrase people use is random arrivals Poisson?

  37. Poisson Distribution Distribution of probability of x events occurring in certain interval https://tinyurl.com/2ad6fewt http://www.dummies.com/education/math/business-statistics/how-to-compute-poisson-probabilities/

  38. Poisson Distribution Example 1. Number of games student plays per day averages 1 per day 2. Number of games played per day independent of all other days 3. Can only play one game at a time What s probability of playing 2 games tomorrow? In this case, the value of = 1, want P(X=2)

  39. Current Poisson Distribution Example https://stattrek.com/online-calculator/poisson.aspx New England city Average new COVID-19 cases 50/day Local hospital has 60 free beds What is the probability more than 60 in one day? Q: How do we get greater than 60? = ??? P(0) + P(1) + + P(60) P( 60) P(>60) = 1 = P( 60)

  40. Current Poisson Distribution Example https://stattrek.com/online-calculator/poisson.aspx New England city Average new COVID-19 cases 50/day Local hospital has 60 free beds What is the probability more than 60 in one day? 60 Q: How do we get greater than 60? = ??? P(0) + P(1) + + P(60) P( 60) P(>60) = 1 = P( 60) 50 60

  41. Current Poisson Distribution Example https://stattrek.com/online-calculator/poisson.aspx https://stattrek.com/online-calculator/poisson.aspx New England city Average new COVID-19 cases 50/day Local hospital has 60 free beds What is the probability more than 60 in one day? 60 Q: How do we get greater than 60? = ??? P(0) + P(1) + + P(60) P( 60) P(>60) = 1 = P( 60) 50 60

  42. Current Poisson Distribution Example https://stattrek.com/online-calculator/poisson.aspx New England city Average new COVID-19 cases 50/day Local hospital has 60 free beds What is the probability more than 60 in one day? 60 Q: How do we get greater than 60? = 0.02 P(0) + P(1) + + P(60) P( 60) P(>60) = 1 = P( 60) 50 60

  43. Current Poisson Distribution Example https://stattrek.com/online-calculator/poisson.aspx New England city Average new COVID-19 cases 50/day Local hospital has 60 free beds What is the probability more than 60 in one day? 60 Q: How do we get greater than 60? = 0.02 P(0) + P(1) + + P(60) P( 60) P(>60) = 1 - P( 60) 50 60

  44. Poisson Distribution So what? Known formulas https://www.researchgate.net/publication/317746840/figure/fig1/AS:779409749 471250@1562837173902/The-Poisson-distribution-probability-function.gif Mean = Variance = Std Dev = sqrt ( ) Excel: poisson.dist() poisson.dist(x,mean,cumulative) mean 50 per day, 60 beds, chance > 60? = 1 - POISSON.DIST(60, 50, TRUE) =0.07216 e.g., Games may want to know likelihood of 1.5x average people arriving at server

  45. Expected Value Formulation Expected value of discrete random variable is value you d expect after many experimental trials. i.e., mean value of population Value: x1 x2 Probability: P(x1)P(x2)P(x3) Compute by multiplying each value by probability and summing x3 xn P(xn) x = E(X) = x1P(x1) + x2P(x2) + + xnP(xn) = xiP(xi)

  46. Expected Value Example Gambling Game Pay $3 to enter Roll 1d6 6? Get $7 1-5? Get $1 What is expected payoff? Expected net? Outcome Payoff 1-5 6 P(x) xP(x) 5/6 $5/6 1/6 $7/6 $1 $7 E(x) = $5/6 + $7/6 = $12/6 = $2 E(net) = E(x) - $3 = $2 - $3 = 0

  47. Expected Value Example Gambling Game Pay $3 to enter Roll 1d6 6? Get $7 1-5? Get $1 What is expected payoff? Expected net? OutcomePayoff 1-5 6 P(x) xP(x) 5/6$5/6 1/6$7/6 $1 $7 E(X) = $5/6 + $7/6 = $12/6 = $2 E(net) = E(x) - $3 = $2 - $3 = 0

  48. Expected Value Example Gambling Game Pay $3 to enter Roll 1d6 6? Get $7 1-5? Get $1 What is expected payoff? Expected net? Outcome Payoff 1-5 6 P(x) xP(x) 5/6 $5/6 1/6 $7/6 $1 $7 E(X) = $5/6 + $7/6 = $12/6 = $2 E(net) = E(X) - $3 = $2 - $3 = $-1

  49. Expected Value Example Gambling Game Pay $3 to enter Roll 1d6 6? Get $7 1-5? Get $1 What is expected payoff? Expected net? OutcomePayoff 1-5 6 P(x) xP(x) 5/6$5/6 1/6$7/6 $1 $7 E(X) = $5/6 + $7/6 = $12/6 = $2 E(net) = E(X) - $3 = $2 - $3 = $-1

  50. Outline Intro Probability Probability Distributions Discrete (done) (done) (done) So far random variable could take only discrete set of values Q: What does that mean? Q: What other distributions might we consider?

More Related Content

giItT1WQy@!-/#giItT1WQy@!-/#giItT1WQy@!-/#giItT1WQy@!-/#giItT1WQy@!-/#giItT1WQy@!-/#giItT1WQy@!-/#