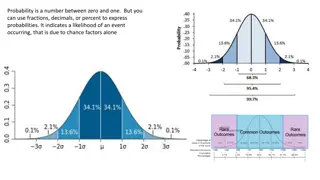
Probability Analysis in Surveys
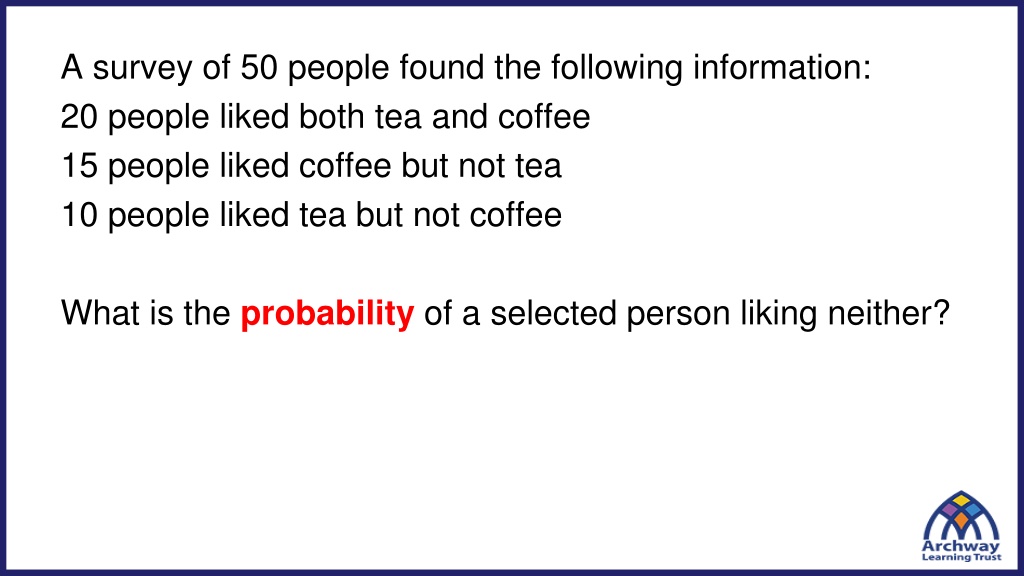


A survey of 50 people found the following information:
20 people liked both tea and coffee
15 people liked coffee but not tea
10 people liked tea but not coffee
W
h
a
t
i
s
t
h
e
p
r
o
b
a
b
i
l
i
t
y
o
f
a
s
e
l
e
c
t
e
d
p
e
r
s
o
n
l
i
k
i
n
g
n
e
i
t
h
e
r
?
A survey of 50 people found the following information:
20 people liked both tea and coffee
15 people liked coffee but not tea
10 people liked tea but not coffee
W
h
a
t
i
s
t
h
e
p
r
o
b
a
b
i
l
i
t
y
o
f
a
s
e
l
e
c
t
e
d
p
e
r
s
o
n
l
i
k
i
n
g
n
e
i
t
h
e
r
?
?
?
?
?
?
?
?
?
?
A two-way table can help us solve this
problem…
A survey of 50 people found the following information:
20 people liked both tea and coffee
15 people liked coffee but not tea
10 people liked tea but not coffee
W
h
a
t
i
s
t
h
e
p
r
o
b
a
b
i
l
i
t
y
o
f
a
s
e
l
e
c
t
e
d
p
e
r
s
o
n
l
i
k
i
n
g
n
e
i
t
h
e
r
?
A Venn Diagram
can help us solve this
problem…
L
i
k
e
T
e
a
L
i
k
e
C
o
f
f
e
e
4
15
20
10
5
On your whiteboards…
In a class of 25 students, 15 students had Tik-tok and 18
students had Snapchat. There were 12 students that had
both.
D
r
a
w
t
h
i
s
i
n
f
o
r
m
a
t
i
o
n
i
n
t
o
a
V
e
n
n
D
i
a
g
r
a
m
6
12
3
S
T
4
On your whiteboards…
In a class of 25 students, 15 students had Tik-tok and 18
students had Snapchat. There were 12 students that had
both.
D
r
a
w
t
h
i
s
i
n
f
o
r
m
a
t
i
o
n
i
n
t
o
a
T
w
o
-
W
a
y
T
a
b
l
e
6
12
3
S
T
4
On your whiteboards…
In a class of 25 students who either play piano, violin or
both, 16 play the piano and 19 play the violin.
D
r
a
w
t
h
i
s
i
n
f
o
r
m
a
t
i
o
n
i
n
t
o
a
V
e
n
n
D
i
a
g
r
a
m
9
10
6
V
i
o
l
i
n
P
i
a
n
o
On your whiteboards…
In a class of 25 students who either play piano, violin or
both, 16 play the piano and 19 play the violin.
D
r
a
w
t
h
i
s
i
n
f
o
r
m
a
t
i
o
n
i
n
t
o
a
T
w
o
-
W
a
y
T
a
b
l
e
9
10
6
V
i
o
l
i
n
P
i
a
n
o
?
?
?
?
?
?
?
?
?
Q1. The Venn Diagram and the two-way table show the same information.
Complete them both.
9
P
l
a
y
s
C
e
l
l
o
P
l
a
y
s
P
i
a
n
o
50
__
__
Q2. The Venn Diagram and the two-way table show the same information.
Complete them both.
__
__
13
R
i
g
h
t
-
h
a
n
d
e
d
M
a
l
e
15
Q3. There are 30 students in a class.
18 study Spanish.
13 study German.
7 study neither Spanish nor German.
Complete the Venn diagram and the two way table to represent this information
and find the number of students who study Spanish and German.
__
G
e
r
m
a
n
S
p
a
n
i
s
h
7
__
__
Q4. In a class of 30 students, 15 play football and 11 play tennis.
Twice as many students play neither sport as play both sports.
Draw a Venn diagram and complete the two-way table to represent this
information and find the number of students who play both football and tennis.
__
T
e
n
n
i
s
F
o
o
t
b
a
l
l
8
__
__
Q5. There are some cars in a car park.
40% of the cars are Fords. Of the Fords, 6 were white.
There were three times as many cars that were neither white nor Ford as there
were white Fords.
Complete the Venn Diagram and the two way table
6
W
h
i
t
e
F
o
r
d
s
__
__
__
Q1. The Venn Diagram and the two-way table show the same information.
Complete them both.
9
P
l
a
y
s
C
e
l
l
o
P
l
a
y
s
P
i
a
n
o
50
37
4
Q2. The Venn Diagram and the two-way table show the same information.
Complete them both.
96
88
13
R
i
g
h
t
-
h
a
n
d
e
d
M
a
l
e
15
Q3. There are 30 students in a class.
18 study Spanish.
13 study German.
7 study neither Spanish nor German.
Complete the Venn diagram and the two way table to represent this information
and find the number of students who study Spanish and German.
8
G
e
r
m
a
n
S
p
a
n
i
s
h
7
10
5
Q4. In a class of 30 students, 15 play football and 11 play tennis.
Twice as many students play neither sport as play both sports.
Draw a Venn diagram and complete the two-way table to represent this
information and find the number of students who play both football and tennis.
4
T
e
n
n
i
s
F
o
o
t
b
a
l
l
8
11
7
Q5. There are some cars in a car park.
40% of the cars are Fords. Of the Fords, 6 were white.
There were three times as many cars that were neither white nor Ford as there
were white Fords.
Complete the Venn Diagram and the two way table
6
W
h
i
t
e
F
o
r
d
s
__
__
__
C
h
a
l
l
e
n
g
e
There are 3 clubs - chess, drama and art. All the members of a
group of 35 students belong to at least one club. 8 of the students
belong to only art club. 6 of the students belong to all 3 clubs. 3 of
the students belong to chess and art clubs but not to drama club. 18
of the students belong to art club. 3 of the students belong only to
chess club. 4 of the students belong only to drama club.
(a) How many students belongs to chess club and to drama club but
not to art club?
(b) How many students belong to chess club?
Allow students to have a go using any method they prefer
Probability concepts through survey data analysis involving preferences for tea, coffee, social media platforms, and musical instruments. Use Venn diagrams and two-way tables to understand overlapping preferences and calculate probabilities of different outcomes. Strengthen your statistical reasoning skills with visual representations and numerical calculations.

Download Presentation

Please find below an Image/Link to download the presentation.
The content on the website is provided AS IS for your information and personal use only. It may not be sold, licensed, or shared on other websites without obtaining consent from the author.If you encounter any issues during the download, it is possible that the publisher has removed the file from their server.
You are allowed to download the files provided on this website for personal or commercial use, subject to the condition that they are used lawfully. All files are the property of their respective owners.
The content on the website is provided AS IS for your information and personal use only. It may not be sold, licensed, or shared on other websites without obtaining consent from the author.
E N D
Presentation Transcript
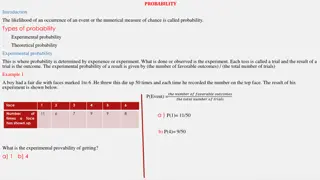
A survey of 50 people found the following information: 20 people liked both tea and coffee 15 people liked coffee but not tea 10 people liked tea but not coffee What is the probability of a selected person liking neither?
A survey of 50 people found the following information: 20 people liked both tea and coffee 15 people liked coffee but not tea 10 people liked tea but not coffee What is the probability of a selected person liking neither? Total Like Coffee Dislike Coffee A two-way table can help us solve this problem 20 ? 10 ? 30 ? Like Tea 5 ? 20 ? 15 ? ? Dislike Tea 15 ? 50 ? Total 35
A survey of 50 people found the following information: 20 people liked both tea and coffee 15 people liked coffee but not tea 10 people liked tea but not coffee What is the probability of a selected person liking neither? Like Coffee Like Tea 4 20 15 10 A Venn Diagram can help us solve this problem 5
On your whiteboards In a class of 25 students, 15 students had Tik-tok and 18 students had Snapchat. There were 12 students that had both. Draw this information into a Venn Diagram S T 6 3 12 4
On your whiteboards In a class of 25 students, 15 students had Tik-tok and 18 students had Snapchat. There were 12 students that had both. Draw this information into a Two-Way Table Total S No S S T T 6 3 12 No T 4 Total
On your whiteboards In a class of 25 students who either play piano, violin or both, 16 play the piano and 19 play the violin. Draw this information into a Venn Diagram Piano Violin 9 6 10
On your whiteboards In a class of 25 students who either play piano, violin or both, 16 play the piano and 19 play the violin. Draw this information into a Two-Way Table Doesn t play Violin Total Plays Violin Piano Violin 16 ? 10 ? ? 6 Plays Piano 9 6 10 Doesn t Play Piano 9 ? ? 9 ? 0 19 ? 25 ? 6 ? Total
Q1. The Venn Diagram and the two-way table show the same information. Complete them both. Plays Cello Plays Piano Does not play the Cello __ __ Total Plays Cello 9 46 Plays Piano 50 Does not play Piano Total 13
Q2. The Venn Diagram and the two-way table show the same information. Complete them both. Right - handed Male Total Right-handed Left-handed 13 __ __ 101 Male 15 Female Total 212
Q3. There are 30 students in a class. 18 study Spanish. 13 study German. 7 study neither Spanish nor German. Complete the Venn diagram and the two way table to represent this information and find the number of students who study Spanish and German. Studies German Does not study German Total German Spanish Studies Spanish __ __ __ Does not study Spanish 7 Total 30
Q4. In a class of 30 students, 15 play football and 11 play tennis. Twice as many students play neither sport as play both sports. Draw a Venn diagram and complete the two-way table to represent this information and find the number of students who play both football and tennis. Does not play tennis Total Plays tennis Tennis Football Plays football __ __ __ Does not play football 8 Total 30
Q5. There are some cars in a car park. 40% of the cars are Fords. Of the Fords, 6 were white. There were three times as many cars that were neither white nor Ford as there were white Fords. Complete the Venn Diagram and the two way table Total White Not White White Fords 20 Ford __ __ 6 Not a Ford __ Total
Q1. The Venn Diagram and the two-way table show the same information. Complete them both. Plays Cello Plays Piano Does not play the Cello 37 4 Total Plays Cello 9 9 37 46 Plays Piano 50 Does not play Piano 4 50 54 Total 13 87 100
Q2. The Venn Diagram and the two-way table show the same information. Complete them both. Right - handed Male Total Right-handed Left-handed 13 88 96 88 13 101 Male 15 96 15 111 Female Total 184 28 212
Q3. There are 30 students in a class. 18 study Spanish. 13 study German. 7 study neither Spanish nor German. Complete the Venn diagram and the two way table to represent this information and find the number of students who study Spanish and German. Studies German Does not study German Total German Spanish Studies Spanish 8 10 18 10 5 8 Does not study Spanish 5 7 12 7 Total 13 17 30
Q4. In a class of 30 students, 15 play football and 11 play tennis. Twice as many students play neither sport as play both sports. Draw a Venn diagram and complete the two-way table to represent this information and find the number of students who play both football and tennis. Does not play tennis Total Plays tennis Tennis Football 4 11 15 Plays football 11 7 4 Does not play football 7 8 15 8 Total 11 19 30
Q5. There are some cars in a car park. 40% of the cars are Fords. Of the Fords, 6 were white. There were three times as many cars that were neither white nor Ford as there were white Fords. Complete the Venn Diagram and the two way table Total White Not White White Fords 6 14 20 Ford __ __ 6 12 18 30 Not a Ford __ Total 18 32 50
Challenge There are 3 clubs - chess, drama and art. All the members of a group of 35 students belong to at least one club. 8 of the students belong to only art club. 6 of the students belong to all 3 clubs. 3 of the students belong to chess and art clubs but not to drama club. 18 of the students belong to art club. 3 of the students belong only to chess club. 4 of the students belong only to drama club. (a) How many students belongs to chess club and to drama club but not to art club? (b) How many students belong to chess club?