Power Dynamics and Decision-Making in the European Union
The European Union's power structure involves various bodies like the European Parliament, Council of Ministers, and Commission. The path for reforms has seen challenges, such as the failed Treaty of Nice and the eventual ratification of the Lisbon Treaty. Member countries have diverse voting strengths, reflecting a delicate balance of power. The EU's decision-making process is influenced by maintaining intergovernmental and federal elements, as shown in historical reforms and treaties.
Download Presentation

Please find below an Image/Link to download the presentation.
The content on the website is provided AS IS for your information and personal use only. It may not be sold, licensed, or shared on other websites without obtaining consent from the author.If you encounter any issues during the download, it is possible that the publisher has removed the file from their server.
You are allowed to download the files provided on this website for personal or commercial use, subject to the condition that they are used lawfully. All files are the property of their respective owners.
The content on the website is provided AS IS for your information and personal use only. It may not be sold, licensed, or shared on other websites without obtaining consent from the author.
E N D
Presentation Transcript
Who has the Power in the EU? Francesco Passarelli, Harvard, Bocconi, and Teramo University of Macau - , March 2nd2012 Based on a paper with J. M. Barr, Rutgers University
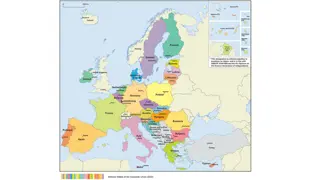
EU Members Old Members Newly Acceding Countries Austria Belgium Denmark France Finland Germany Greece Ireland Italy Luxembourg Netherlands Portugal Spain Sweden United Kingdom Bulgaria Cyprus Czech Rep. Estonia Hungary Latvia Lithuania Malta Poland Romania Slovakia Slovenia (2007) (2004) (2004) (2004) (2004) (2004) (2004) (2004) (2004) (2007) (2004) (2004) Croatia Turkey (2013) (na)
The EU Government European Parliament MEPs Directly Elected by citizens Legislative Branch Council of Ministers Ministers from member governments Legislative Branch Commission Appointed commissioners Agenda Setter
EU Council EU s main decision making body Represents member governments Members are one minister from each member s national government Rotating presidency Weighted votes Most issues are passed by qualified majority
The path for reforms Historical dichotomy: Locating the optimal balance between the intergovernmental nature of the EU and a federal development The Treaty of Nice (12/2000) failed to find a solution Laeken Summit (12/2001), a new method: the Constitutional Convention Bruxelles Summit (6/ 2003) endorsed the Convention's proposals Rome (10/2004) the Constitutional Treaty (CT) signed
The path for reforms 5/2005, French and Dutch vote NO to the Constitution 10/2007, the heads of states decided to Constitution and keep the institutional reforms within the Lisbon Treaty 5/2008, Ireland said NO in a referendum which stopped again the ratification process. October 2009, a second referendum in Ireland passed the ratification. The Lisbon Treaty comes into force on the 1st December 2009.
EU 27 Votes EU 27 Votes - - Pre Pre - - and Post Nice and Post Nice Country Pre-Nice Nice Ger, Fra, Ita, UK Spa, Pol 10 8 29 27 Romania Netherlands Belg, Cze, Gree, Hung, Port Aus, Swe, Bulg Den, Ire, Lith, Slova, Fin Cyp, Est, Lat, Lux, Slov Malta Total 13 13 12 10 7 4 3 5 5 4 3 2 87 345
EU 27 Qualified Majority Nice 245 votes out of 345=72% A majority of member states approve Any member state can ask for confirmation that the decision represents 62% of EU s total population
Nice: Votes and Population Votes per 1M People Votes vs. Population 8 35 7 Votes 30 6 25 5 20 4 Spain, Poland 15 3 10 2 5 1 0 0 Mal 0 50 100 RomItaFraUK AusBul Hun Bel NethPol Spa Fin S...Est LithIreLat Cyp Den Lux Gre Por Ger Slova Cze Swe Population (Millions)
Nice: the probability of making a Nice: the probability of making a decisio decision Spain, Poland
Lisbons Plan Nice agreement viewed as too decentralized Small countries have more power to block bills they don t like Lisbon s plan attempts to: Centralize power in hands of big 4 Preserve democratic foundations Simplify rules
Lisbon: Qualified Majority At least 15 out of 27 countries vote yes And 65% of population (314 millions votes) votes yes
EU 27 EU 27 Lisbon Lisbon Country Votes Sweden Bulgaria Austria Slovakia Denmark Finland 8,883 8,170 8,121 5,401 5,349 5,181 Country Germany UK France Italy Spain Poland Romania Netherlands Greece Czech Rep Belgium Hungary Portugal Votes 82,193 59,832 59,521 57,844 39,490 38,649 22,443 15,983 10,565 10,272 10,262 10,024 10,023 Ireland Lithuania Latvia Slovenia Estonia Cyprus Luxembourg Malta 3,820 3,696 2,417 1,989 1,436 671 441 390
Background research questions Is Lisbon s decision-making system fair? Does it have any democratic foundations? Is there any democratic deficit in the EU? Is this a relevant issue?
How to address these questions? We focus on the Council of Ministers We model legislative bargaining in the Council We call ''value'' (or power) the worth of playing that legislative bargaining
What is Power? Prestige Ability of tipping the final decision in the most preferred direction The value of the vote
Political power results from The decisional rules set in the Constitution: (Super)-majority threshold Voting weights And Voters' preferences (i.e., their ideological profiles )
How to measure power? In a completely agnostic perspective Shapley-Shubik (1954): a voter's power is her chance to play a pivotal role Voters are symmetric: preferences or ideologies are not considered
What happens if we consider ideological profiles? The legislators have to coordinate in order to make a common decision The idea that the median-voter is the most powerful one emerges this results from the idea that only some orderings are possible It suggests that we must concentrate on how voters enter coalitions (i.e. in which order) basically: orderings in which ideologically similar players are close should be more likely (and vice versa)
An example: simple majority Five voters, no weights, A B C D E right left C is the most powerful one only if: The proposal comes either from A The ordering is A,B,C,D,E or from E The ordering is E,D,C,B,A
What happens if. . the proposal comes from C, or from D? . voting is weighted? . there is a super-majority threshold? . there is an agenda setter? . the political space is multidimensional? A B C D E left right
Two dimensional space Two issues, x: government spending; y: defense policy aggressive E A D high low C B moderate
The literature on ideological power Shapley, 1977 Owen, 1972 Owen and Shapley, 1989 Rabinowitz and MacDonald, 1986
Our Paper We use the Owen-Shapley (1989) approach to generate ordering probabilities We use Eurobarometer data to build up a political space We look at how an Agenda setter (the Commission) can impact on ordering probabilities, and affect power We compare the old system (Nice) with the Lisbon Treaty
Three formulas Probabilistic value Probability of a political coalition Owen and Shapley We add an Agenda setter that blows the political wind
Research Question How do number of votes per country, majority threshold levels, preferences of countries, preferences of the agenda setter affect power of countries within the Council of Ministers?
Data: Eurobarometer (EB) Public opinion of citizens of member states. Standard EB established in 1973. Each survey consists of 1000 face-to-face interviews per Member. Reports are published twice yearly.
Eurobarometer Our study: Avg. of 3 surveys We use data collected on citizen s opinions regarding who should have control over EU policies. 25 questions range of inter-national and intra- national issues Data are aggregated in two dimensions using the Principal Component Analysis (an econometric technique)
For each of the following areas, do you thing that decisions should be made by (NATIONALITY) government, or made jointly within the EU? Issue Issue 1 Defense 13 Information about the EU, its policies and institutions. 2 Protection of the environment 14 Foreign policy toward countries outside EU 3 Currency 15 Cultural policy 4 Humanitarian aid 16 Immigration policy 5 Health and social welfare 17 political asylum 6 Media 18 organized crime 7 Fight against poverty/social exclusion 19 police 8 Fight against unemployment 20 justice 9 Agriculture and fishing policy 21 accepting refugees 10 Support of regions experiencing economic difficulties 22 juvenile crime 11 Education 23 Urban crime 12 Scientific and technological research 24 Drugs 25 exploitation of human beings
Avg. % "Pro-EU" Responses for "EU27 80 70 60 50 40 30 20 10 0 Fin Rom Ita Malta Ger Ire Den Hun Neth Gre Esto Lith UK Lat Lux Bul Bel Pol Ptgl Cyp Spa Fra Slova Slove Aus Czw Swed
EU 27: Preferences 2 Poland Cyprus Slovakia Slovenia Latvia 1 Estonia Hungary Romania Lithuani Czech intra-national stance Greece Bulgaria Malta 0 Denmark Ireland Germany Spain Portugal Sweden Belgium Luxembou Italy -1 Netherla Austria France UK Finland -2 -2 -1 0 1 2 inter-national stance
EU 15 Pre-Nice: Measures of Power Country Votes S-S S-O Spatial 10 0.117 Germany 0.142 5 0.055 Portugal 0.141 8 0.095 Spain 0.118 10 0.117 France 0.114 4 0.045 Austria 0.092 5 0.055 Belgium 0.083 5 0.055 Netherlands 0.076 3 0.035 Ireland 0.059 10 0.117 UK 0.048 4 0.045 Sweden 0.047 5 0.055 Greece 0.045 10 0.117 Italy 0.025 3 0.035 Finland 0.009 2 0.021 Luxembourg 0.003 3 0.035 Denmark 0.000
EU 27 Nice EU 27 Nice Country Votes S-S S-O Spatial 12 0.034 Czech Rep 0.132 29 0.087 France 0.101 29 0.087 Germany 0.091 27 0.080 Spain 0.089 12 0.034 Greece 0.063 10 0.028 Bulgaria 0.062 13 0.037 Netherlands 0.054 7 0.020 Lithuania 0.048 29 0.087 Italy 0.048 27 0.080 Poland 0.035 12 0.034 Belgium 0.033 14 0.040 Romania 0.030 12 0.034 Portugal 0.024 7 0.020 Slovakia 0.024
EU 27 Nice continued Country Votes S-S S-O Spatial Hungary 12 0.034 0.023 Ireland 7 0.020 0.021 Latvia 4 0.011 0.021 Denmark 7 0.020 0.020 Sweden 10 0.028 0.017 UK 29 0.087 0.016 Cyprus 4 0.011 0.014 Austria 10 0.028 0.011 Finland 7 0.020 0.010 Slovenia 4 0.011 0.006 Luxembourg 4 0.011 0.004 Malta 3 0.008 0.003 Estonia 4 0.011 0.000
EU 27 Lisbon Country Votes S-S S-O Spatial Austria 8,121 0.020 0.017 Belgium 10,262 0.023 0.022 Bulgaria 8,170 0.020 0.065 Cyprus 671 0.008 0.012 Czech Rep 10,272 0.023 0.035 Denmark 5,349 0.016 0.030 Estonia 1,436 0.010 0.025 Finland 5,181 0.015 0.016 France 59,521 0.107 0.092 Germany 82,193 0.157 0.185 Greece 10,565 0.024 0.023 Hungary 10,024 0.022 0.006 Ireland 3,820 0.013 0.048 Italy 57,844 0.105 0.076
EU 27 Lisbon cont Country Votes S-S NBI S-O Spatial Latvia 2,417 0.011 0.017 0.018 Lithuania 3,696 0.013 0.019 0.035 Luxembourg 441 0.008 0.015 0.000 Malta 390 0.009 0.014 0.004 Netherlands 15,983 0.032 0.033 0.033 Poland 38,649 0.071 0.063 0.001 Portugal 10,023 0.023 0.027 0.050 Romania 22,443 0.042 0.042 0.049 Slovakia 5,401 0.016 0.021 0.025 Slovenia 1,989 0.011 0.016 0.009 Spain 39,490 0.073 0.064 0.070 Sweden 8,883 0.021 0.025 0.006 UK 59,832 0.108 0.091 0.047
The democratic deficit (%) SSI SSI-pop S-O S-O-pop Pop Nice Lis Nice Lis Nice Lis Nice Lis 60.5 34.8 49.1 -25.7 -11.4 25.6 38.5 -34.9 -22.0 Four big states Franco-German axis 12 Acceding members 33.0 17.4 27.3 -15.6 -5.7 19.2 31.3 -13.8 -1.7 24.6 30.8 23.3 6.2 -1.3 39.8 26.2 15.2 1.6 18.2 16.0 14.3 -2.2 -3.9 12.4 21.3 -5.8 3.1 Spain and Poland Scandinavian +UK 18.5 15.7 13.6 -2.8 -4.9 5.3 6.3 -13.2 -12.2
