Polymerization of Hexamethylene Diisocyanate in Solution and Its Impact on Human Cells
This study investigates the polymerization of hexamethylene diisocyanate (HDI) in solution and its interaction with exposed human cells. Multiple mass spectrometry analyses reveal the formation of phosphate adducts of hydrolyzed HDI, dimeric hydrolyzed HDI, and reaction products in the presence or absence of proteins like albumin. The research provides insights into the molecular changes induced by HDI exposure and the potential implications for cellular responses.
Download Presentation

Please find below an Image/Link to download the presentation.
The content on the website is provided AS IS for your information and personal use only. It may not be sold, licensed, or shared on other websites without obtaining consent from the author.If you encounter any issues during the download, it is possible that the publisher has removed the file from their server.
You are allowed to download the files provided on this website for personal or commercial use, subject to the condition that they are used lawfully. All files are the property of their respective owners.
The content on the website is provided AS IS for your information and personal use only. It may not be sold, licensed, or shared on other websites without obtaining consent from the author.
E N D
Presentation Transcript
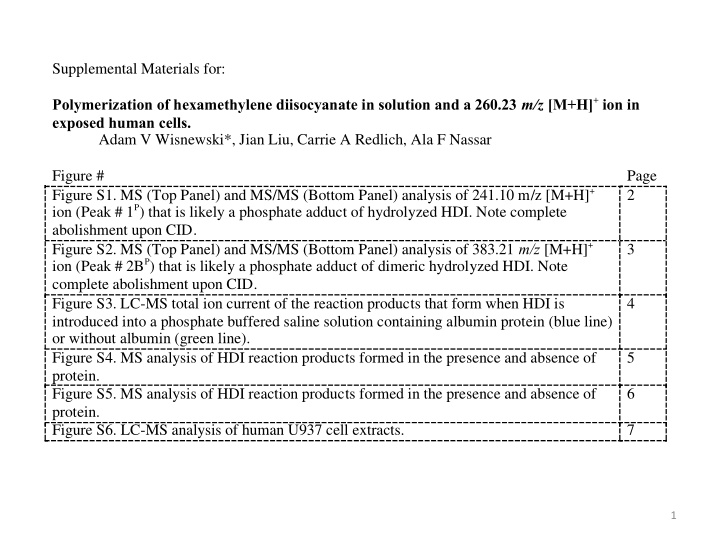
Supplemental Materials for: Polymerization of hexamethylene diisocyanate in solution and a 260.23 m/z [M+H]+ ion in exposed human cells. Adam V Wisnewski*, Jian Liu, Carrie A Redlich, Ala F Nassar Figure # Figure S1. MS (Top Panel) and MS/MS (Bottom Panel) analysis of 241.10 m/z [M+H]+ ion (Peak # 1P) that is likely a phosphate adduct of hydrolyzed HDI. Note complete abolishment upon CID. Figure S2. MS (Top Panel) and MS/MS (Bottom Panel) analysis of 383.21 m/z [M+H]+ ion (Peak # 2BP) that is likely a phosphate adduct of dimeric hydrolyzed HDI. Note complete abolishment upon CID. Figure S3. LC-MS total ion current of the reaction products that form when HDI is introduced into a phosphate buffered saline solution containing albumin protein (blue line) or without albumin (green line). Figure S4. MS analysis of HDI reaction products formed in the presence and absence of protein. Figure S5. MS analysis of HDI reaction products formed in the presence and absence of protein. Figure S6. LC-MS analysis of human U937 cell extracts. Page 2 3 4 5 6 7 1
Figure S1. MS (Top Panel) and MS/MS (Bottom Panel) analysis of 241.10 m/z [M+H]+ ion (Peak # 1P) that is likely a phosphate adduct of hydrolyzed HDI. Note complete abolishment upon CID.
Figure S2. MS (Top Panel) and MS/MS (Bottom Panel) analysis of 383.21 m/z [M+H]+ ion (Peak # 2BP) that is likely a phosphate adduct of dimeric hydrolyzed HDI. Note complete abolishment upon CID.
2.5E+09? 2E+09? 1.5E+09? 1E+09? 500000000? 0? 0? 0.5? 1? 1.5? 2? 2.5? 3? 3.5? 4? 4.5? Figure S3. LC-MS total ion current of the reaction products that form when HDI is introduced into a phosphate buffered saline solution containing albumin protein (blue line) or without albumin (green line). Y axis depicts ion intensity and X-axis is retention time in minutes. 4
Figure S4. MS analysis of HDI reaction products formed in the presence and absence of protein. Products with a retention time of 3.4 minutes (Peak# 2B in Figure 1) formed when HDI is reacted in the presence (top panel) or absence (bottom panel) of albumin. Note relative increase in larger polymers (e.g. [M+H]+ ions with larger m/zs ) as highlighted with arrows, in the absence of albumin. *922.0098 m/z [M+H]+ ion is calibration reference. 5
Figure S5. MS analysis of HDI reaction products formed in the presence and absence of protein. Products with a retention time of 2.1 minutes (Peak# 2BP in Figure 1) formed when HDI is reacted in the presence (top panel) or absence (bottom panel) of albumin. Note relative increase in larger polymers (e.g. [M+H]+ ions with larger m/zs ) as highlighted with arrows, in the absence of albumin. 6
A Figure S6. LC-MS analysis of human U937 cell extracts. Panel A. BPC of U937 cell extracts following culture with <3kDa reaction products of HDI in phosphate buffered saline (red dashed line) vs control buffer identically incubated and processed (solid black line). Y-axis depicts ion intensity and X-axis depicts retention time in minutes. Panel B. MS of major peak (see arrow) containing the novel 260.23 m/z [M+H]+ ion. Panel C. MS of major peak (see arrow) containing the 259.25 m/z [M+H]+ ion, and the corresponding doubly charged (z=2) ion. *Note Slight delay in retention time compared to Figures in main manuscript as starting buffer B was reduced to 2%. Base Peak 260.23 m/z Base Peak 259.25 m/z B 260.23 m/z (z=1) 130.13 m/z (z=2) C 259.25 m/z (z=1) 7
