Overview of Aurangabad Division: Population, Districts, and Governance
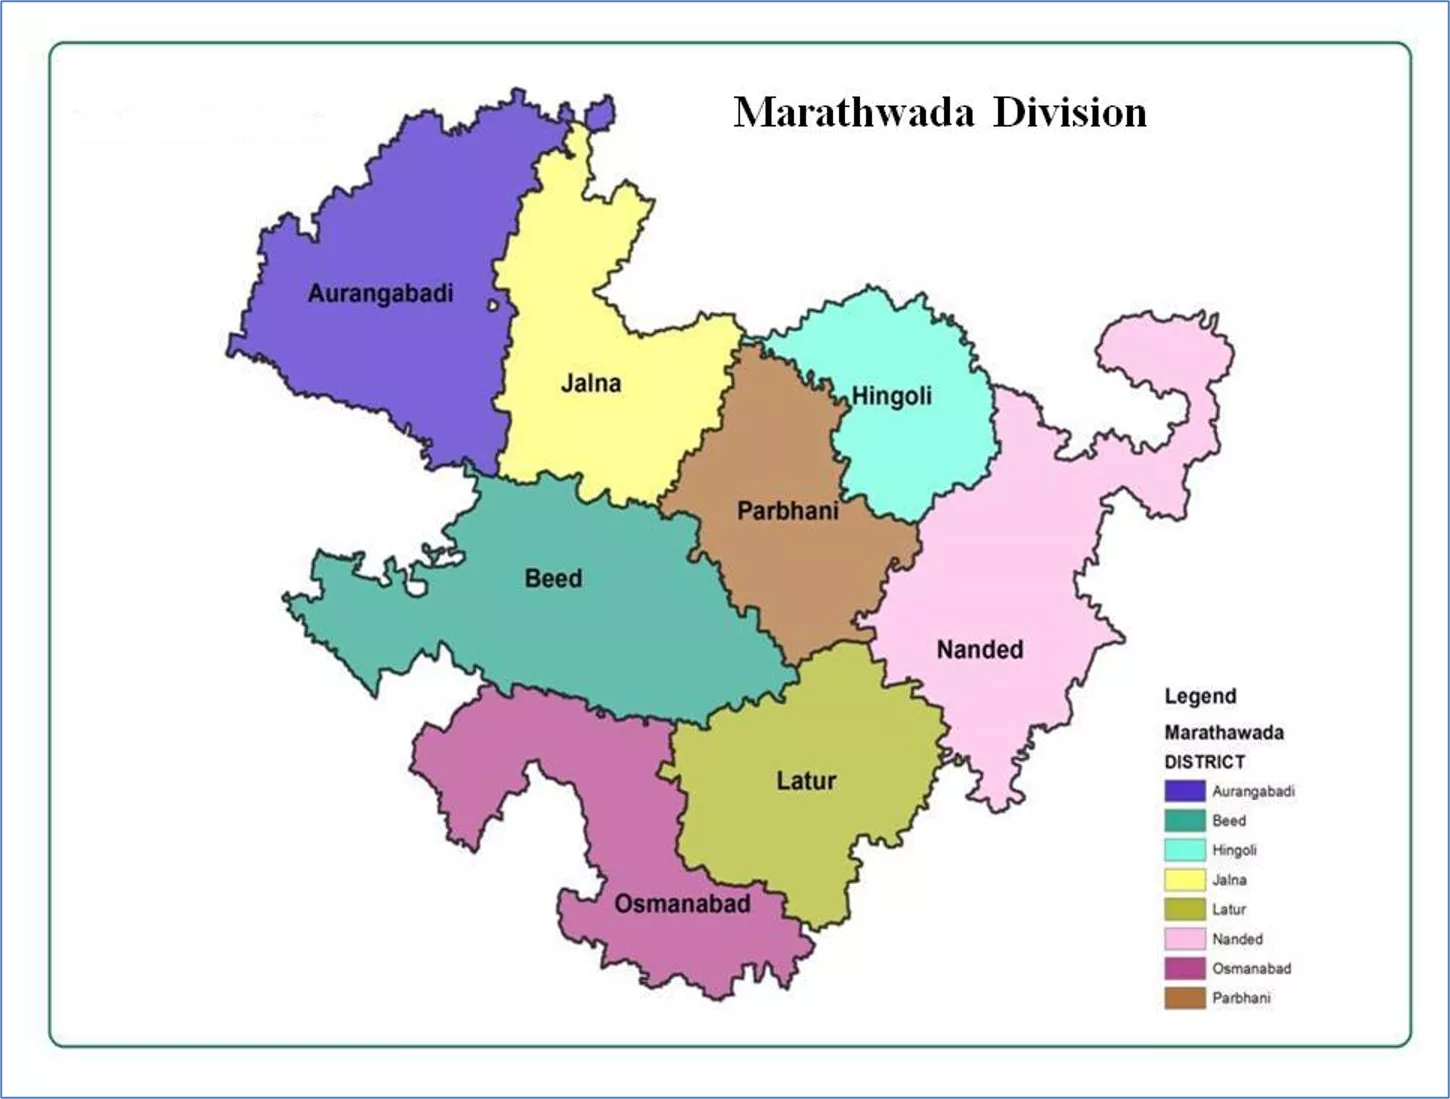
Aurangabad Division is home to a total population of 1,87,27,728 spread across 8 districts, 76 talukas, and 8559 revenue villages. The division comprises 8 Zilla Parishads and 76 Panchayat Samitis, showcasing a well-structured governance system in place.
Download Presentation

Please find below an Image/Link to download the presentation.
The content on the website is provided AS IS for your information and personal use only. It may not be sold, licensed, or shared on other websites without obtaining consent from the author. Download presentation by click this link. If you encounter any issues during the download, it is possible that the publisher has removed the file from their server.
E N D
Presentation Transcript
Divisional Commissioner Office, Aurangabad Divisional Commissioner Aurangabad 0
Aurangabad Division : General Information 1 Total Population 1,87,27,728 2 Districts 8 3 Taluka 76 4 Revenue Villages 8559 5 Zilla Parishad 8 6 Panchayat Samiti 76 7 Grampanchayat 6651 8 Municipal Corporations 4 9 Municipal Councils 50 10 Nagar Panchayat 25 11 Cultivators (Lakh) : (i) Small 13.33 (ii) Marginal 14.03 (iii) Large 7.47 Total 34.83
Aurangabad Division : General Information 14 Geographical Area (Lakh ha.) 64.41 15 Forest Area (Lakh ha.) 2.37 16 Cultivable Area (Lakh ha.) 54.51 17 Sugarcane Industries (Functional) 54 18 Sugarcane Area 3.13 Lakh Hectare 19 Average Rainfall (mm) 779.00 Godavari, Purna, Dudhana, Painganga, Manjara and Terna 20 Major Rivers Soil Type Deep and Medium Black Cotton Soil Geology Deccan Trap Basalt 99%, Local Alluvium 1% 21 Irrigation Projects : Major 11 Medium 75 Minor 749
Rainfall in Aurangabad Division * Topographically Marathwada situated in such way that it always receives less rain as compare to the rest of Maharashtra. * Rainfall in Marathwada is also variable, erratic and deficient many time. * Though average rainfall of Marathwada is 779mm, last ten years average is 684mm. * Deficient Rainfall during last few years is as below : 2012-13 (69%), 2014-15 (53%), 2015-16(56%), and during 2018-19 (64%) which leads to continuous drought like situation in the region. 4
Aurangabad Division Actual Railfall Yearwise Actual Rainfall in Last 10 Years (Average Rainfall 779mm) Percentage Average Rainfall 1200 973 1000 917 879 854 800 779 673 655 600 538 502 434 414 400 200 125 118 113 110 86 84 69 64 56 53 0 Year 2009-10 Year 2010-11 Year 2011-12 Year 2012-13 Year 2013-14 Year 2014-15 Year 2015-16 Year 2016-17 Year 2017-18 Year 2018-19 5
Aurangabad Division Actual Rainfall & it's Percentage from 2009-10 to 2018-19 2009-10 2010-11 2011-12 2012-13 2013-14 2014-15 2015-16 2016-17 2017-18 2018-19 1 2 3 4 5 6 7 8 9 10 11 Actual Rainfall 917 973 655 538 854 414 434 879 673 502 Percentage 118 125 84 69 110 53 56 113 86 64 6
Aurangabad Division District wise Rainfall : 2018-19 (mm) Average Rainfall Aurangabad 675 Actual Rainfall Percentage District 360 53 Jalna 425 62 688 Beed 334 50 666 Latur 516 64 802 Osmanabad 451 58 777 Nanded 774 81 956 Parbhani 483 62 775 Hingoli 672 75 893 A'bad Division 502 64 779 7
Districtwise Rainfall : 2018-19 Average Rainfall : Actual Rainfall ( mm) Average Rainfall 1200 Actual Railfall Percentage 1000 956 893 802 779 777 775 774 800 688 675 672 666 600 516 502 483 451 425 360 400 334 200 81 75 64 64 62 62 58 53 50 0 Aurangabad Jalna Beed Latur Osmanabad Nanded Parbhani Hingoli A'bad Division 8
Aurangabad Division Rainfall and Tankers * During 2009-10, Aurangabad division received 118% rainfall and 412 tankers were deployed. * In 2014-15, division received 53% and in 2015-16, division received 56% rainfall, due to consecutive two years deficient rainfall 4015 tankers were deployed in 2016 for drinking water which was highest. * In 2018-19, rainfall was 64% due to drought like condition in Marathwada, resulting deployment of 3545 tankers. 9
Aurangabad Division Maximum No.of Tankers in Last 10 Years Year 2010 Year 2011 Year 2012 Year 2013 Year 2014 Year 2015 Year 2016 Year 2017 Year 2018 Year 2019 District Aurangabad 172 55 174 740 333 541 937 436 636 1174 Jalna 35 103 341 552 327 325 606 147 152 706 Parbhani 6 23 39 0 26 27 291 36 32 109 Hingoli 8 17 16 2 12 12 51 5 18 75 Nanded 27 135 217 42 219 215 360 51 111 138 Beed 160 47 294 582 260 517 962 41 22 985 Latur 0 57 27 12 105 101 360 6 2 115 Osmanabad 4 41 199 206 162 152 448 8 0 243 A'bad Division 412 478 1307 2136 1444 1890 4015 730 973 3545 10
Aurangabad Division A'bad Division Maximum No.of Tankers in Last 10 Years 4500 4015 4000 3545 3500 3000 2500 2136 1890 2000 1444 1307 1500 973 1000 730 478 412 500 0 Year 2010 Year 2011 Year 2012 Year 2013 Year 2014 Year 2015 Year 2016 Year 2017 Year 2018 Year 2019 11
Aurangabad Division Number of Villages & Hamlets provided Drinking Water by Tankers Villages 3500 Hamlets 2972 3000 2502 2500 2000 1732 1428 1500 1146 1017 1002 887 1000 848 776 629 551 507 473 368 365 500 187 177 176 133 0 Year 2010 Year 2011 Year 2012 Year 2013 Year 2014 Year 2015 Year 2016 Year 2017 Year 2018 Year 2019 12
Aurangabad Division Actual Railfall Year wise Rainfall and Tankers in Last 10 Years (Average Rainfall 779mm) Percentage Average Rainfall 1200 No.of Tankers shown in Red Bracket . 973 1000 917 879 854 800 779 673 655 600 538 502 434 414 400 200 125 118 113 110 86 84 69 64 56 53 0 Year 2009-10 Year 2010-11 Year 2011-12 Year 2012-13 Year 2013-14 Year 2014-15 Year 2015-16 Year 2016-17 Year 2017-18 Year 2018-19 (412) (478) 1307) (2136) (1444) (1890) (4015) (730) (973) (3545) 13
Aurangabad Division Designated Water Storages in Marathwada (mm ) Sr. No. Project District Designed (mm3) 1 Major Project 11 5143.00 2 Medium Project 75 940.43 3 Minor Project 749 1712.88 4 Godavari River Barrages 13 324.77 Terna / Manjra / Rena River Barrages 5 24 72.23 Aurangabad Division 872 8193.36 14
Aurangabad Division Designated Water Storages in Major Dam (mm ) Sr. No. 1 2 3 4 5 6 7 8 9 10 11 Aurangabad Division Project District Designed (mm3) 2171 809 81 312 177 964 91 138 81 242 76 5143 Jayakwadi Yeldari Siddheshwar Majalgaon Manjara Upper Painganga Lower Terna Lower Manar Vishnupuri Lower Dudhana Sina Kolegaon Aurangabad Parbhani Hingoli Beed Beed Yeotmal Osmanabad Nanded Nanded Parbhani Osmanabad 15
Aurangabad Division Major Irrigation Project * Capacity of all 11 Major Dams in Marathwada is 5143 mm . * In last 10 years average storage was 2451mm i.e. (48%). * Highest live storage was 4024mm (78%) during 2010 where as during 2013 it was only 834mm (16%). 16
Aurangabad Division Major Project : Live Storage for Last 10 Years (Designated Storage 5143mm ) 4500 4024 3776 4000 3674 3607 3500 2982 3000 2500 1985 2000 1731 1500 1048 849 834 1000 500 0 Year 2009 Year 2010 Year 2011 Year 2012 Year 2013 Year 2014 Year 2015 Year 2016 Year 2017 Year 2018 (20) (71) (34) (70) (39) (58) (78) (73) (17) (16) 17
Aurangabad Division Designated Water Storages in Medium Projects (mm ) Sr.No. 1 District No.of Projects Designated (mm ) Aurangabad 205.50 16 2 Jalna 68.50 07 3 Beed 150.31 16 4 Latur 122.15 08 5 Osmanabad 202.86 17 6 Nanded 139.07 09 7 Parbhani 52.04 02 8 Hingoli 0.00 00 Division Total = 75 940.43 18
Aurangabad Division Medium Irrigation Project * In Marathwada there are total 75 Medium irrigation project which having capacity of 940.43mm . * In last 10 years average storage was 488.28mm i.e.52%. * During 2010 the live sotrage of Medium dam was highest 726.85mm (77%) where as during 2015 it was 167.74mm (17.3%) 19
Aurangabad Division Medium Project : Live Storage for Last 10 Years (Designated Store 940.43mm ) 900 776.03 800 726.85 663.45 700 629.16 585.88 600 516.79 500 400 311.38 304.06 300 201.49 167.74 200 100 0 Year 2009 Year 2010 Year 2011 Year 2012 Year 2013 Year 2014 Year 2015 Year 2016 Year 2017 Year 2018 (55.0 %) (77.3%) (70.5%) (62.3%) (32.3%) (33.1%) (66.9%) (82.5%) (17.3%) (21.4%) 20
Aurangabad Division Designated Water Storages in Minor Projects (mm ) Sr.No. District No.of Projects Designated (mm ) Aurangabad 188.22 1 93 Jalna 169.09 2 57 Beed 286.52 3 126 Latur 304.86 4 132 Osmanabad 475.63 5 205 Nanded 193.32 6 88 Parbhani 42.21 7 22 Hingoli 53.03 8 26 Aurangabad Division 1712.88 749 21
Aurangabad Division Minor Dams * In Marathwada there are total 749 minor dam having storage capacity of 1712.88mm . * In last 10 years average storage was 692.36mm i.e.40%. * In last 9 year, during 2016 the live storage was 1352.41mm (79%) where as during 2015 live storage was 179.61mm (10.5%) which was lowest. 22
Aurangabad Division Minor Project : Live Storage for Last 10 Years (Designated Storage 1712.87mm ) 3000 1352.41 2500 1028.68 957.82 2000 937.47 832.17 1500 479.31 1000 416.31 389.54 500 350.32 179.61 0 Year 2009 Year 2010 Year 2011 Year 2012 Year 2013 Year 2014 Year 2015 Year 2016 Year 2017 Year 2018 (24.3%) (10.5%) (28.0%) (60.1%) (48.6%) (22.7%) (54.7%) (79.0%) (55.9%) (20.5%) 23
Aurangabad Division Under Ground Water Level. In Marathwada region there are 76 Talukas. Out of which, in 71 Talukas there is decrease in static water level. * There are 875 observation well to measure the underground water levels. * It is also seen that, there is decrease in Static Water Level (SWL) in all 8 districts and average decrease in water level is 1.84 meter. * Highest decrease in SWL is in Osmanabad-3.21Mt., followed by Beed- 2.59Mt. and Jalna- 2.42Mt. * 24
Aurangabad Division Statement showing Average Static Water Level (SWL) in Observation Wells March, 2019 Sr. No. District Number of Talukas No. of Taluka s Water Level Increased Taluks showing the decrease in SWL (In mtrs.) No. of Taluka s Water Level Decreased 8 9 0 to 01 mtr 01 to 02 mtr 02 to 03 mtr Above 03 mtr 1 1 2 3 9 4 1 5 5 6 2 7 1 9 0 Aurangabad Jalna 8 0 2 5 1 8 0 2 Parbhani 9 1 5 1 1 8 1 3 Hingoli 5 3 2 0 0 5 0 4 Nanded 16 8 4 0 0 12 4 5 Latur 10 0 9 1 0 10 0 6 Osmanabad 8 0 1 3 4 8 0 7 Beed 11 0 3 5 3 11 0 8 A,bad Division 76 13 31 17 10 71 5 25
Aurangabad Division Statement showing Average Static Groundwater Level (SWL) in Observation Wells March, 2019 V/s Last 5 Years Average Static Groundwater Level in March Sr. No. District Number of Observation Wells Average of SWL (mtr) in March Last 5 Years The Average Water Level (mtr) in March 2019 Status of SWL (+) (-) (mtr) 1 2 3 4 5 6 Aurangabad 141 11.48 13.27 -1.79 1 Jalna 110 9.46 11.88 -2.42 2 Parbhani 86 10.14 11.75 -1.61 3 Hingoli 55 9.44 10.42 -0.98 4 8.62 Nanded 134 9.1 -0.48 5 Latur 109 8.52 10.14 -1.62 6 Osmanabad 114 8.53 11.74 -3.21 7 Beed 126 8.66 11.25 -2.59 8 A,bad Division 875 9.36 11.19 -1.84 26
Aurangabad Divison Graph showing Static Water level in March, 2019 0 2 Waterlevels in meter 4 6 8 10 12 14 Aurangabad Jalna Parbhani Hingoli Nanded Latur Osmanabad Beed Avg SWLOf Last 5 Years In mt AVG WL Of March 2019 mt 11.48 13.27 9.46 11.88 10.14 11.75 9.44 10.42 8.62 9.10 8.52 10.14 8.53 11.74 8.66 11.25 Avg SWLOf Last 5 Years In mt AVG WL Of March 2019 mt 27
Taluka wise Decrease/Increase Static Water Level (SWL) in March, 2019 V/s Last 5 Years in March District Number of Included Taluka s Sr. No. Taluka s Showing Decrease / Increase in Water Level (mtr) of March 2019 Compared to the Last 5 Years 0 to1 mtr 1 to 2 mtr 2 to 3 mtr Above 3 mtr No. of Taluka s Water Level Increase 8 3 4 5 6 7 1 2 Aurangabad, Phulambri, Kannad, Vaijapur, Gangapur (05) 9 Aurangabad Khultabad (01) Paithan, Sillod (02) Soygaon (01) 0 1 Jalna, Bhokardan, Jafrabad, Partur, Mantha (05) Badnapur (01) 8 Jalna 0 Ambad, Ghansawangi (02) 0 2 Manwat, Gangakhed, Sonpeth, Jintur, Purna (05) 9 Parbhani Palam (01) Parbhani (01) Selu (01) Pathri (01) 3 Hingoli, Kalamnuri, Sengaon (03) 5 Hingoli Aundha, Vasmat (02) 0 0 0 4 Hadgaon, Kandhar, Ardhapur, Naigaon (04) Nanded, Mudkhed, Umri, Kinwat,Mahur,Himayatnag ar, Bhokar, Biloli (08) Degloor, Mukhed, Dharmabad, Loha (04) 16 Nanded 0 0 5 Ausa, Udgir, Deoni, Jalkot, Ahmadpur, Nilanga, Shirur, Chakur, Renapur (09) 10 Latur 0 Latur (01) 0 0 6 Osmanabad, Lohara, Vashi, Paranda (04) Omerga, Bhoom, Kalamb (03) 8 Osmanabad 0 Tuljapur (01) 0 7 Patoda, Shirur Kasar, Majalgaon, Wadwani, Parali (05) Georai, Kaij, Dharur (03) 11 Beed 0 Beed, Ashti, Ambajogai (03) 0 8 528 76 Division Total 13 31 17 10
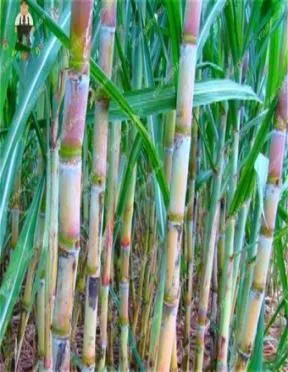
Aurangabad Division Area of Sugarcane against Total Area * Total cultivable area Aurangabad Division-54.51 Lakh ha. * Total Irrigated area 11.19 Lakh ha. * Average Area under Sugarcane (Last 10 Years) 2.16 Lakh ha. And during 2018-19 it was 3.13 ha. * Sugarcane area against total cultivable area 5.74%. * Sugarcane area against total irrigated area 27.97%. 29
Area under sugarcane in Marathwada comparisation with Maharashtra. ( 2018-19) * Cultivable Area of Maharashtra -224 Lakh ha. * Cultivable Area of Marathwada -54 Lakh ha * Percentage of Cultivable Area of Marathwada 24%. * Total Area under Sugarcane Maharashtra 11.63 Lakh ha * Total Area under Sugarcane Marathwada 3.13 Lakh ha * Percentage of Sugarcane Area of Marathwada 27%. * Average Sugarcane productivity - Maharashtra 85.37 MT/ha. Marathwada 57.28 MT/ha. 30
Aurangabad Division Statement showing Sugarcane Plantation ( Area in Lakh Hectares ) District 2009-10 2010-11 2011-12 2012-13 2013-14 2014-15 2015-16 2016-17 2017-18 2018-19 Sr.No. 1 2 3 3 4 5 6 7 8 9 10 11 1 Aurangabad 0.14 0.23 0.20 0.15 0.15 0.14 0.15 0.15 0.21 0.26 2 Jalna 0.18 0.19 0.19 0.13 0.14 0.21 0.26 0.16 0.24 0.38 3 Beed 0.43 0.59 0.54 0.51 0.46 0.38 0.36 0.12 0.36 0.50 4 Latur 0.4 0.33 0.43 0.46 0.42 0.46 0.42 0.09 0.40 0.62 5 Osmanabad 0.38 0.43 0.55 0.52 0.69 0.40 0.23 0.12 0.35 0.57 6 Nanded 0.13 0.14 0.24 0.13 0.12 0.19 0.19 0.15 0.23 0.23 7 Parbhani 0.11 0.16 0.17 0.17 0.36 0.27 0.29 0.09 0.25 0.46 8 Hingoli 0.08 0.05 0.08 0.09 0.07 0.15 0.15 0.05 0.10 0.11 A'bad Division 1.85 2.12 9.64 2.40 10.22 2.16 9.38 2.41 9.37 2.2 10.3 2.05 9.87 0.93 6.33 2.14 9.02 3.13 11.63 State 7.56 31
Aurangabad Division A'bad Division Total Statement showing Sugarcane-Plantation ( Area in Lakh Hectares ) 3.5 3.13 3 2.40 2.41 2.5 2.2 2.16 2.12 2.14 2.05 1.85 2 1.5 0.93 1 0.5 0 2009-10 2010-11 2011-12 2012-13 2013-14 2014-15 2015-16 2016-17 2017-18 2018-19 32
Aurangabad Division Statement showing Sugarcane Production ( Lakh M.T.) Sr. No. 1 District 2009-10 2010-11 2011-12 2012-132013-142014-152015-162016-172017-182018-19 2 3 3 4 5 6 7 8 9 10 11 1 Aurangabad 11.55 19.60 17.05 6.31 11.70 9.32 6.70 8.73 11.73 13.23 2 Jalna 16.94 11.93 13.06 8.03 9.72 10.08 13.34 6.12 14.17 20.02 3 Parbhani 8.57 14.15 11.66 12.12 25.50 15.77 7.64 5.79 13.75 19.19 4 Hingoli 4.70 3.04 5.57 6.78 5.16 8.55 4.63 3.13 6.65 7.50 5 Nanded 6.21 8.27 17.52 10.48 10.21 11.13 5.30 8.60 14.95 10.48 6 Beed 31.95 38.75 34.87 28.17 25.67 17.23 7.98 4.96 20.73 15.28 7 Latur 30.31 22.64 31.13 30.51 29.03 23.55 12.48 5.09 24.40 37.38 8 Osmanabad 31.92 31.75 36.63 22.34 31.75 15.92 6.14 4.28 15.75 24.31 A'bad Division 142.15 150.13 167.49 124.74 148.74 111.55 64.21 46.70 122.13 147.39 State 641.59 856.91 894.56 753.35 839.54 915.38 692.35 542.36 831.37 917.04 33
Aurangabad Division Statement showing Sugarcane Productivity ( MT/Ha ) Sr. No. 1 District 2009-10 2010-11 2011-12 2012-13 2013-14 2014-15 2015-16 2016-17 2017-18 2018-19 2 3 3 4 5 6 7 8 9 10 11 Aurangabad 85.00 84.00 85.00 43.00 80.00 37.00 44.00 60.00 55.00 50.03 1 Jalna 93.00 62.00 70.00 63.00 72.00 48.00 51.00 37.00 60.00 53.00 2 Parbhani 78.00 91.00 68.00 71.00 71.00 58.00 27.00 64.00 55.00 42.00 3 Hingoli 59.00 66.00 66.00 75.00 72.00 56.00 30.00 63.00 70.00 67.00 4 Nanded 48.00 60.00 73.00 82.00 84.00 59.00 28.00 59.00 65.00 45.00 5 Beed 74.00 66.00 65.00 55.00 56.00 46.00 22.00 40.60 58.00 30.80 6 Latur 76.00 69.00 73.00 66.00 70.00 51.00 30.00 57.00 61.00 60.00 7 Osmanabad 84.00 74.00 67.00 43.00 46.00 40.00 27.00 36.00 45.00 42.50 8 A'bad Division 76.84 70.82 69.79 57.75 61.72 50.70 31.32 50.22 57.07 47.09 State 90.00 89.00 88.00 80.00 90.00 89.00 70.00 86.00 92.00 78.80 34
Aurangabad Division Sugarcane Production (Lakh MT) and Productivity (MT/Ha) 180 A'bad Division Prod. 167.49 160 150.13 148.74 147.39 A'bad Division Yield 142.14 140 124.74 122.13 120 111.55 100 76.84 80 70.82 69.79 64.21 61.72 57.75 57.07 50.22 60 50.70 46.70 47.09 40 31.32 20 0 2009-10 2010-11 2011-12 2012-13 2013-14 2014-15 2015-16 2016-17 2017-18 2018-19 35
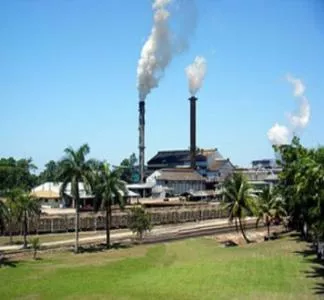
Aurangabad Division Sugarcane factories, Crushing Capacity, Actual Crushing Sugar Production * Functional sugar factories is (both co-operative & Private) were 46 in 2010-11 which increased up to 54 in 2018-19. * Crushing capacity of sugarcane factories was 94550 MT/Day in 2010-11 which increased up to 1,57,050 in 2018-19. * Actual crushing of sugarcane in 2010-11 was 130.03 lakh MT which was increased up to 194.31 Lakh MT in 2018-19 . * Sugar Production was 14.23 Lakh MT during 2010-11 which is increased up to 20.91 Lakh MT during 2018-19. * The production of alcohol in sugarcane factory in 2010-11 was 579.86 Lakh Litres which increased by 1110.98 Lakh Litres during 2018-19. 36
Aurangabad Division Number of Functional Sugar Factories Sr.No. District 2010-11 2011-12 2012-13 2013-14 2014-15 2015-16 2016-17 2017-18 2018-19 1 2 3 4 5 6 7 8 9 10 11 5 5 5 4 5 5 3 6 6 Aurangabad 1 4 4 4 3 5 5 4 5 5 Jalna 2 4 4 5 4 4 4 3 5 5 Parbhani 3 3 3 3 3 3 4 3 4 5 Hingoli 4 3 3 4 3 3 3 2 5 5 Nanded 5 8 8 5 4 6 5 4 7 7 Beed 6 8 10 11 9 9 8 1 8 8 Latur 7 11 14 9 8 8 7 2 10 13 Osmanabad 8 A'bad Division 46 51 46 38 43 41 22 50 54 37
Aurangabad Division Number of Functional Sugar Factories 60 54 51 50 50 46 46 43 41 38 40 30 22 20 10 0 2010-11 2011-12 2012-13 2013-14 2014-15 2015-16 2016-17 2017-18 2018-19 38
Aurangabad Division Sugar Factories Crushing Capacity (MT/Day) Sr.No District 2010-11 2011-12 2012-13 2013-14 2014-15 2015-16 2016-17 2017-18 2018-19 1 2 3 4 5 6 7 8 9 10 11 Aurangabad 8250 7000 9950 8700 10350 9950 6700 10450 10450 1 Jalna 10000 10000 10000 7500 14000 12500 11500 14000 14000 2 Parbhani 11250 11250 14750 14750 18250 18250 18250 14750 18250 3 Hingoli 6250 6250 6250 7500 6250 7500 7750 8050 10650 4 Nanded 5000 5000 5000 8750 12950 16150 18250 17000 17000 5 Beed 19000 20000 9750 13700 20950 10650 7950 15750 15750 6 Latur 11250 20750 19500 18250 21750 26000 25900 28250 34750 7 Osmanabad 23550 30250 20250 29750 32000 41650 41000 40500 36200 8 A'bad Division 94550 110500 95450 108900 136500 142650 137300 148750 157050 39
Aurangabad Division Sugar Factories Crushing Capacity (MT/Day) 180000 157050 160000 148750 142650 137300 136500 140000 120000 108900 110500 95450 94550 100000 80000 60000 40000 20000 0 2010-11 2011-12 2012-13 2013-14 2014-15 2015-16 2016-17 2017-18 2018-19 40
Aurangabad Division Sugar Factories Actual Crushing (Lakh MT) Sr.No District 2010-11 2011-12 2012-13 2013-14 2014-15 2015-16 2016-17 2017-18 2018-19 1 2 3 4 5 6 7 8 9 10 11 Aurangabad 9.96 9.24 7.71 5.49 14.81 10.17 3.03 16.69 18.06 1 Jalna 12.50 14.15 10.76 7.08 16.78 12.61 5.86 21.16 21.82 2 Parbhani 9.89 15.03 13.60 11.12 18.15 10.72 1.86 17.75 21.01 3 Hingoli 7.27 9.13 9.02 8.22 10.42 8.46 2.47 11.25 11.01 4 Nanded 5.71 8.33 8.12 10.43 13.23 9.22 3.68 13.92 11.38 5 Beed 27.80 26.12 18.69 15.76 26.13 12.36 3.78 34.45 33.52 6 Latur 21.36 36.29 33.63 29.04 33.51 14.74 1.34 35.70 35.24 7 Osmanabad 35.53 39.47 26.36 23.98 40.78 14.26 1.29 38.76 42.27 8 A'bad Division 130.02 157.76 127.89 111.12 173.81 92.54 23.31 189.68 194.31 41
Aurangabad Division Actual Crushing by Sugar Factories (Lakh Metric Tonnes) 250 194.28 189.65 200 173.8 157.71 150 130.03 127.88 111.12 92.54 100 50 23.3 0 2010-11 2011-12 2012-13 2013-14 2014-15 2015-16 2016-17 2017-18 2018-19 42
Aurangabad Division Sugar Production by Sugar Factories (Lakh MT) District 2010-11 2011-12 2012-13 2013-14 2014-15 2015-16 2016-17 2017-18 2018-19 Sr.No. 1 2 3 4 5 6 7 8 9 10 11 Aurangabad 1.05 0.99 0.77 0.51 1.51 1.01 0.26 1.66 1.92 1 Jalna 1.30 1.54 1.12 0.71 1.73 1.28 0.53 2.16 2.43 2 Parbhani 1.10 1.80 1.50 1.09 1.82 1.05 0.16 1.83 2.28 3 Hingoli 0.83 1.08 1.02 0.96 1.18 0.93 0.25 1.22 1.25 4 Nanded 0.65 0.95 0.91 1.21 1.45 1.05 0.39 1.52 1.26 5 Beed 2.93 2.90 1.97 1.54 2.64 1.15 0.33 3.42 3.38 6 Latur 2.46 4.35 3.79 3.11 3.76 1.57 0.14 4.01 4.04 7 Osmanabad 3.91 4.42 2.74 2.39 4.17 1.35 0.12 3.92 4.35 8 14.23 18.03 13.82 11.52 18.26 9.39 2.18 19.74 20.91 A'bad Division 43
Aurangabad Division Sugar Production by Sugar Factories (Lakh MT) 25.00 20.91 19.74 20.00 18.26 18.03 14.23 15.00 13.82 11.52 9.39 10.00 5.00 2.18 0.00 2010-11 2011-12 2012-13 2013-14 2014-15 2015-16 2016-17 2017-18 2018-19 44
Aurangabad Division Alcohol Production in Sugarcane Factories (Lakh Litres) Sr. No. District Year 2010-11 Year 2011-12 Year 2012-13 Year 2013-14 Year 2014-15 Year 2015-16 Year 2016-17 Year 2017-18 Year 2018-19 1 3 4 5 6 7 8 9 10 11 12 1 Aurangabad 0.00 0.00 0.00 0.00 0.00 0.00 0.00 0.00 0.00 2 Jalna 43.65 56.11 39.60 36.06 36.26 37.43 15.70 35.61 53.36 3 Beed 201.73 176.24 146.20 138.65 183.69 167.38 96.22 134.49 262.68 4 Latur 114.96 160.82 177.66 172.51 163.26 156.81 34.20 161.72 269.71 5 Osmanabad 107.49 138.99 123.01 110.62 125.87 109.56 33.67 145.39 297.34 6 Nanded 44.12 53.31 59.47 56.38 53.09 44.55 43.16 42.16 55.29 7 Parbhani 29.60 114.03 120.00 110.28 90.23 135.00 62.90 73.32 128.70 8 Hingoli 38.31 44.92 42.66 32.01 47.24 39.07 14.45 43.93 43.90 579.86 744.42 708.60 656.51 699.64 689.80 300.30 636.62 1110.98 A'bad Division 45
Aurangabad Division Alcohol Production by Sugarcane Factories (Lakh Litres) 1200.00 1110.98 1000.00 744.42 800.00 708.60 699.64 689.80 656.51 636.62 579.86 A'bad 600.00 400.00 300.30 200.00 0.00 2010-11 2011-12 2012-13 2013-14 2014-15 2015-16 2016-17 2017-18 2018-19 46
Aurangabad Division Drinking Water Requirement * Population of Aurangabad Division (As per Census 2011) - 187.81 Lakh. * Estimated Population in 2019- Approximate - 212.67 Lakh. * Approximate Urban Population in 2019 - 97.82 Lakh. * Water requirement for urban bodies ( Town - 70 lpcd, Cities PWP/S - 135 lpcd and Metropolitian Cities- 150 lpcd). We considered here average 100 lpcd, i.e. 9782 Lakh Litres. * Annual requirement of water for Urban Area will be 35,70,430 Lakh Litres. It comes to 357mm . 47
Aurangabad Division Drinking Water Requirement * Approximate Rural Population in 2019 - 116.97 Lakh and Requirement of drinking as per water 40 lpcd, it will come 4678 Lakh lpcd. Annual Requirement will be 1707762 Lakh Litres, it comes to 171 mm . * Total Rural and Urban Water Requirement will be 528mm . * Total Water Requirement for human being and Animals will be :- * Human Being- 528 mm Animal- 62 mm * Total Water Requirement -- 590mm 48
Aurangabad Division Number of Animals, Requirement of Water (Lakh Litres) Requirement for Year (10 x 365 Days) No.of Animals as per 11th Census Water Requirement Small Animal Large Animal Sheep & Goat Total Small Animal (15 Ltr. Per Day) Large Animal (40 Ltr. Per Day) Sheep & Goat (4 Ltr. Per Day) Total Sr. No. District Population Requirement Per Day (Lakh Letter) 1 2 3 4 5 6 3 4 5 6 7 Aurangabad 168118 508062 391232 1067412 25.22 203.22 15.65 244.09 89093.50 1 Jalna 84625 405127 209272 699024 12.69 162.05 8.37 183.12 66837.13 2 Beed 225657 596707 402434 1224798 33.85 238.68 16.10 288.63 105349.48 3 Latur 197970 395940 158516 752426 29.70 158.38 6.34 194.41 70960.43 4 Osmanabad 113791 412014 211542 737347 17.07 164.81 8.46 190.34 69472.61 5 Nanded 200943 679307 294475 1174725 30.14 271.72 11.78 313.64 114479.79 6 Parbhani 88138 374503 159559 622200 13.22 149.80 6.38 169.40 61832.55 7 Hingoli 57152 283830 118698 459680 8.57 113.53 4.75 126.85 46301.24 8 A'bad Division 11363943655490 1945728 6737612 170.46 1462.20 77.83 1710.48 624326.74 Total Water Requirement will be 62.4mm . * 49


