Overcoming Inequality: Neighborhoods and Opportunities


John N. Friedman
 
Brown University
 
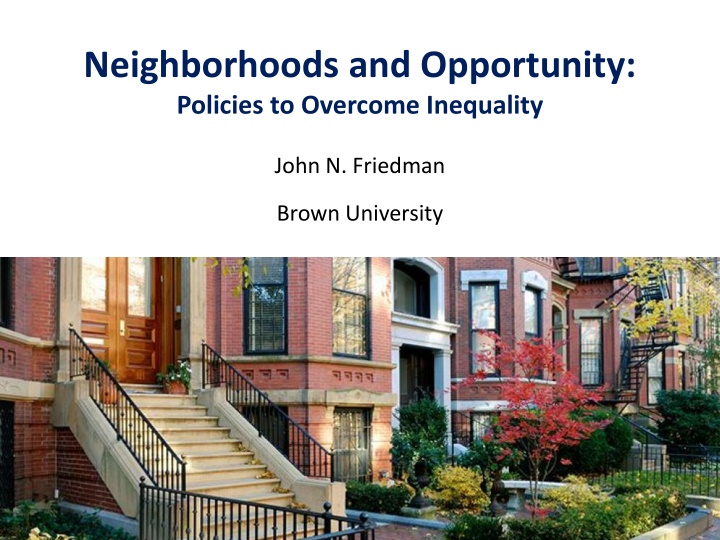
Neighborhoods and Opportunity:
Policies to Overcome Inequality
 
XX Insert photo from
But make the image lower quality so that it takes up less memory and
loads fater
 
T
h
e
 
A
m
e
r
i
c
a
n
 
D
r
e
a
m
?
 
Probability that a child born to parents in the bottom fifth
of the income distribution reaches the top fifth:


Probability that a child born to parents in the bottom fifth
of the income distribution reaches the top fifth:


C
a
n
a
d
a
 
D
e
n
m
a
r
k
 
U
K
 
U
S
A
 
1
3
.
5
%
 
1
1
.
7
%
 
7
.
5
%
 
9
.
0
%
 
Blanden and Machin 2008
 
Boserup, Kopczuk, and Kreiner 2013
 
Corak and Heisz 1999
 
Chetty, Hendren, Kline, Saez 2014
 
T
h
e
 
A
m
e
r
i
c
a
n
 
D
r
e
a
m
?
 
Probability that a child born to parents in the bottom fifth
of the income distribution reaches the top fifth:


Chances of achieving the “American Dream” are almost
    two times higher in Canada than in the U.S.
 
C
a
n
a
d
a
 
D
e
n
m
a
r
k
 
U
K
 
U
S
A
 
1
3
.
5
%
 
1
1
.
7
%
 
7
.
5
%
 
9
.
0
%
 
Blanden and Machin 2008
 
Boserup, Kopczuk, and Kreiner 2013
 
Corak and Heisz 1999
 
Chetty, Hendren, Kline, Saez 2014
 
T
h
e
 
A
m
e
r
i
c
a
n
 
D
r
e
a
m
?
 
T
h
e
 
G
e
o
g
r
a
p
h
y
 
o
f
 
U
p
w
a
r
d
 
M
o
b
i
l
i
t
y
 
i
n
 
t
h
e
 
U
n
i
t
e
d
 
S
t
a
t
e
s
 
Chances of Reaching the Top Fifth Starting from the Bottom Fifth by Metro Area
 
S
a
n
J
o
s
e
1
2
.
9
%
 
S
a
l
t
 
L
a
k
e
 
C
i
t
y
 
1
0
.
8
%
 
A
t
l
a
n
t
a
 
4
.
5
%
 
W
a
s
h
i
n
g
t
o
n
 
D
C
 
1
1
.
0
%
 
C
h
a
r
l
o
t
t
e
 
4
.
4
%
 
D
e
n
v
e
r
 
8
.
7
%
 
B
o
s
t
o
n
 
1
0
.
4
%
 
M
i
n
n
e
a
p
o
l
i
s
 
8
.
5
%
 
M
i
l
w
a
u
k
e
e
4
.
5
%
 
D
a
l
l
a
s
-
F
t
.
 
W
o
r
t
h
7
.
1
%
 
0%
 
20%
 
40%
 
60%
 
80%
 
100%
 
10
 
15
 
20
 
25
 
30
 
Age of Child when Parents Move
 
 
Percentage Gain from Moving to a Better Area
 
E
f
f
e
c
t
s
 
o
f
 
M
o
v
i
n
g
 
t
o
 
a
 
D
i
f
f
e
r
e
n
t
 
N
e
i
g
h
b
o
r
h
o
o
d
o
n
 
a
 
C
h
i
l
d
s
 
I
n
c
o
m
e
 
i
n
 
A
d
u
l
t
h
o
o
d
 
b
y
 
A
g
e
 
a
t
 
M
o
v
e
 
Dallas
 
Atlanta
0%
20%
40%
60%
80%
100%
10
15
20
25
30
Age of Child when Parents Move
 
E
f
f
e
c
t
s
 
o
f
 
M
o
v
i
n
g
 
t
o
 
a
 
D
i
f
f
e
r
e
n
t
 
N
e
i
g
h
b
o
r
h
o
o
d
o
n
 
a
 
C
h
i
l
d
s
 
I
n
c
o
m
e
 
i
n
 
A
d
u
l
t
h
o
o
d
 
b
y
 
A
g
e
 
a
t
 
M
o
v
e
Percentage Gain from Moving to a Better Area
Dallas
Atlanta
 
C
h
i
l
d
r
e
n
 
w
h
o
s
e
 
f
a
m
i
l
i
e
s
 
m
o
v
e
 
f
r
o
m
 
A
t
l
a
n
t
a
 
t
o
 
D
a
l
l
a
s
 
w
h
e
n
t
h
e
y
 
a
r
e
 
9
 
y
e
a
r
s
 
o
l
d
 
g
e
t
 
5
4
%
 
o
f
 
t
h
e
 
g
a
i
n
 
f
r
o
m
 
g
r
o
w
i
n
g
 
u
p
i
n
 
D
a
l
l
a
s
 
f
r
o
m
 
b
i
r
t
h
 
T
h
e
 
G
e
o
g
r
a
p
h
y
 
o
f
 
U
p
w
a
r
d
 
M
o
b
i
l
i
t
y
 
i
n
 
t
h
e
 
U
n
i
t
e
d
 
S
t
a
t
e
s
 
Causal Effects on Income for Poor Children, by County
 
Estimates represent % change in adult earnings for 20 years of childhood spent in county
 
Causal Effects on Earnings for Children in Low-Income Families
 
Top 10 and Bottom 10 Among the 100 Largest Counties in the U.S.
 
Male
 Children
 
Estimates represent % change in adult earnings for 20 years of childhood spent in county
 
Causal Effects on Earnings for Children in Low-Income Families
 
Note: Estimates represent change in rank from spending one more year of childhood in county.
Counties colored by national deciles.
 
T
h
e
 
G
e
o
g
r
a
p
h
y
 
o
f
 
U
p
w
a
r
d
 
M
o
b
i
l
i
t
y
 
i
n
 
t
h
e
 
U
n
i
t
e
d
 
S
t
a
t
e
s
For Children from Low-Income Families
 
Dallas
 
Ft. Worth
 
Grayson
 
Bryan
County, OK
 
Collin
 
Denton
 
Navarro
 
Palo
Pinto
 
Parker
 
Wise
 
Hunt
 
Hopkins
 
Ellis
 
Kaufman
 
Henderson
 
Rockwall
 
Hood
 
Johnson
 
Sommervell
 
Cooke
 
Dallas County: -5.1% (66
th
)
 
Tarrant County: +0.3% (38
th
)
 
Dallas Metro: -2.7% (55
th
)
Ft. Worth Metro: +3.7% (15
th
)
 
Johnson County: +18.0%
 
Note: Estimates represent change in rank from spending one more year of childhood in county.
Counties colored by national deciles.
 
T
h
e
 
G
e
o
g
r
a
p
h
y
 
o
f
 
U
p
w
a
r
d
 
M
o
b
i
l
i
t
y
 
i
n
 
t
h
e
 
U
n
i
t
e
d
 
S
t
a
t
e
s
For Children from High-Income Families
 
Dallas
 
Ft. Worth
 
Grayson
 
Bryan
County, OK
 
Collin
 
Denton
 
Navarro
 
Palo
Pinto
 
Cooke
 
Parker
 
Wise
 
Hunt
 
Hopkins
 
Ellis
 
Kaufman
 
Henderson
 
Rockwall
 
Hood
 
Johnson
 
Sommervell
 
Dallas County: +5.7%
 
Tarrant County: +1.6%
 
Johnson County: +6.2%
 
What are the Characteristics of High-Mobility Areas?
Five Strongest Correlates of Upward Mobility
 
 
1.
Segregation
 
Racial and income segregation associated with less mobility
Long commute times (sprawl) associated with less mobility
 
Source: Cable (2013) based on Census 2010 data
 
R
a
c
i
a
l
 
S
e
g
r
e
g
a
t
i
o
n
 
i
n
 
M
i
l
w
a
u
k
e
e
 
Whites (blue), Blacks (green), Asians (red), Hispanics (orange)
 
R
a
c
i
a
l
 
S
e
g
r
e
g
a
t
i
o
n
 
i
n
 
S
a
c
r
a
m
e
n
t
o
 
Whites (blue), Blacks (green), Asians (red), Hispanics (orange)
 
Source: Cable (2013) based on Census 2010 data
 
F
i
v
e
 
S
t
r
o
n
g
e
s
t
 
C
o
r
r
e
l
a
t
e
s
 
o
f
 
U
p
w
a
r
d
 
M
o
b
i
l
i
t
y
 
1.
Segregation
 
2.
Income Inequality
 
Places with smaller middle class have much less mobility
Upper tail inequality (top 1%) not strongly related to mobility
 
 
F
i
v
e
 
S
t
r
o
n
g
e
s
t
 
C
o
r
r
e
l
a
t
e
s
 
o
f
 
U
p
w
a
r
d
 
M
o
b
i
l
i
t
y
 
1.
Segregation
 
2.
Income Inequality
 
3.
School Quality
 
Higher expenditure, smaller classes, higher test scores correlated with
more mobility


F
i
v
e
 
S
t
r
o
n
g
e
s
t
 
C
o
r
r
e
l
a
t
e
s
 
o
f
 
U
p
w
a
r
d
 
M
o
b
i
l
i
t
y
 
1.
Segregation
 
2.
Income Inequality
 
3.
School Quality
 
4.
Family Structure
 
Areas with more single parents have much lower mobility
Strong correlation even for kids whose 
own
 parents are married
 
 
F
i
v
e
 
S
t
r
o
n
g
e
s
t
 
C
o
r
r
e
l
a
t
e
s
 
o
f
 
U
p
w
a
r
d
 
M
o
b
i
l
i
t
y
 
1.
Segregation
 
2.
Income Inequality
 
3.
School Quality
 
4.
Family Structure
 
5.
Social Capital
 
“It takes a village to raise a child”
Putnam (1995): “Bowling Alone”


C
o
r
r
e
l
a
t
e
s
 
o
f
 
U
p
w
a
r
d
 
M
o
b
i
l
i
t
y
 
i
n
 
D
a
l
l
a
s
 
a
n
d
 
F
o
r
t
 
W
o
r
t
h
 
 
Social Capital
 
Student-Teacher Ratio
 
Fraction Single Moms
 
Income Inequality
 
Racial Segregation
 
Share in Poverty
 
P
o
l
i
c
i
e
s
 
t
o
 
I
m
p
r
o
v
e
 
U
p
w
a
r
d
 
M
o
b
i
l
i
t
y
 
What policy changes can improve mobility?
 
Focus here on two types of policies suggested by
correlations:
 
1.
Reducing segregation: affordable housing policies
 
2.
Improving education: teacher effectiveness


One way to increase integration: give low income families
subsidized housing vouchers to move to better areas
 
 
HUD Moving to Opportunity Experiment: gave such
vouchers using a randomized lottery
 
4
,
600 families in Boston, New York, LA, Chicago, and Baltimore in
mid 1990’s
 
A
f
f
o
r
d
a
b
l
e
 
H
o
u
s
i
n
g
 
a
n
d
 
I
n
t
e
g
r
a
t
i
o
n
 
o
f
 
N
e
i
g
h
b
o
r
h
o
o
d
s
 
Source: Chetty, Hendren, and Katz 2016
 
C
o
m
m
o
n
 
M
T
O
 
R
e
s
i
d
e
n
t
i
a
l
 
L
o
c
a
t
i
o
n
s
 
i
n
 
N
e
w
 
Y
o
r
k
 
Children who moved to low-poverty areas when young
(e.g., below age 13) do much better as adults:
 
30% higher earnings = $100,000 gain over life in present value
27% more likely to attend college
30% less likely to become single parents
 
But moving had little effect on the outcomes of children
who were already teenagers
 
Moving also had no effect on parents’ earnings
 
Reinforces conclusion that 
childhood exposure 
is a key
determinant of upward mobility
 
M
o
v
i
n
g
 
t
o
 
O
p
p
o
r
t
u
n
i
t
y
 
E
x
p
e
r
i
m
e
n
t
 
 
Moving to a mixed-income neighborhood improves outcomes for
low-income children
 
Mixed-income neighborhoods produce, if anything, slightly 
better
outcomes for the rich
 
Integration could help the poor without hurting the rich
 
H
o
u
s
i
n
g
 
P
o
l
i
c
y
 
I
m
p
l
i
c
a
t
i
o
n
s
 
 
Subsidized housing vouchers and changes in urban planning
could increase upward mobility, but there are limits to scalability
 
Moving 
everyone
 in Harlem to Bronx is unlikely to help
 
Ultimately need policies that improve existing
 
neighborhoods rather
than simply moving people around
 
H
o
u
s
i
n
g
 
P
o
l
i
c
y
:
 
L
i
m
i
t
a
t
i
o
n
s
 
U
s
i
n
g
 
B
i
g
 
D
a
t
a
 
t
o
 
S
t
u
d
y
 
T
e
a
c
h
e
r
s
 
I
m
p
a
c
t
s
 
Source: Chetty, Friedman, Hilger, Saez, Schanzenbach, Yagan 2011
 
Source: Chetty, Friedman, Rockoff 2014
 
 
c
u
p
 
I’ll say a word to you.  Listen for the 
ending
 sound.
 
You circle the picture that 
starts
 with the same sound


A
 
K
i
n
d
e
r
g
a
r
t
e
n
 
T
e
s
t


C
o
r
r
e
l
a
t
i
o
n
:
 
W
a
g
e
 
E
a
r
n
i
n
g
s
 
v
s
.
 
K
i
n
d
e
r
g
a
r
t
e
n
 
T
e
s
t
 
S
c
o
r
e
 
 
KG Test Score Percentile
 
Mean Wage Earnings from Age 25-27
 
$10K
 
0
 
20
 
40
 
60
 
80
 
100
 
$15K
 
$20K
 
$25K
 
 
C
a
u
s
a
l
 
E
f
f
e
c
t
 
o
f
 
K
i
n
d
e
r
g
a
r
t
e
n
 
C
l
a
s
s
 
Q
u
a
l
i
t
y
:
 
W
a
g
e
 
E
a
r
n
i
n
g
s
 
Mean Wage Earnings from Age 25-27
$16K
$18K
Below-Average Class Quality
Above-Average Class Quality
$17K
 
$1 million
NPV gains per
classroom
+$875 per year
50
52
54
56
‘93
‘94
‘95
‘96
‘97
‘98
School Year
Average Test Score
A
 
Q
u
a
s
i
-
E
x
p
e
r
i
m
e
n
t
:
 
E
n
t
r
y
 
o
f
 
H
i
g
h
 
Q
u
a
l
i
t
y
 
T
e
a
c
h
e
r
 
51
 
52
 
53
 
54
 
55
 
‘93
 
‘94
 
‘95
 
‘96
 
‘97
 
‘98
 
School Year
 
Average Test Score
 
A
 
Q
u
a
s
i
-
E
x
p
e
r
i
m
e
n
t
:
 
E
n
t
r
y
 
o
f
 
L
o
w
 
Q
u
a
l
i
t
y
 
T
e
a
c
h
e
r
 
50
Teacher Quality
5th
95th
Median
T
h
e
 
V
a
l
u
e
 
o
f
 
I
m
p
r
o
v
i
n
g
 
T
e
a
c
h
e
r
 
Q
u
a
l
i
t
y
 
+$50,000 
lifetime earnings per child
 
= $1.4 million
 per classroom of 28 students
Teacher Quality
5th
95th
Median
T
h
e
 
V
a
l
u
e
 
o
f
 
I
m
p
r
o
v
i
n
g
 
T
e
a
c
h
e
r
 
Q
u
a
l
i
t
y
 
E
q
u
a
l
i
t
y
 
o
f
 
O
p
p
o
r
t
u
n
i
t
y
 
a
n
d
 
E
c
o
n
o
m
i
c
 
G
r
o
w
t
h
 
Traditional argument for greater social mobility is based
on principles of justice
 
But improving opportunities for upward mobility can also
increase size of the economic pie
 
One child’s success need not come at another’s expense
 
To illustrate, focus on innovation
 
Study the lives of 750,000 patent holders in the U.S.
 
Source: Bell, Chetty, Jaravel, Petkova, van Reenen 2015
 
Patent rate for children
with parents in top 1%:
2
2
.
5
 
p
e
r
 
1
0
,
0
0
0
 
P
a
t
e
n
t
 
R
a
t
e
s
 
v
s
.
 
P
a
r
e
n
t
 
I
n
c
o
m
e
 
P
e
r
c
e
n
t
i
l
e
 
 
0
 
5
 
10
 
15
 
20
 
25
 
0
 
20
 
40
 
60
 
80
 
100
 
Parent Income Percentile
 
 
Inventors per Ten Thousand
 
Patent rate for children
with parents below median:
2
.
2
 
p
e
r
 
1
0
,
0
0
0
 
 
-2
 
-1
 
0
 
1
 
2
 
 
P
a
t
e
n
t
 
R
a
t
e
s
 
v
s
.
 
3
r
d
 
G
r
a
d
e
 
T
e
s
t
 
S
c
o
r
e
s
 
Inventors per Ten Thousand
 
15
 
20
 
5
 
0
 
10
 
3rd Grade Math Test Score (Standard Deviations Relative to Mean)
 
85
th
 Percentile
Parent Income Above Median
Parent Income Below Median
P
a
t
e
n
t
 
R
a
t
e
s
 
v
s
.
 
3
r
d
 
G
r
a
d
e
 
T
e
s
t
 
S
c
o
r
e
s
f
o
r
 
C
h
i
l
d
r
e
n
 
w
i
t
h
 
L
o
w
 
v
s
.
 
H
i
g
h
 
I
n
c
o
m
e
 
P
a
r
e
n
t
s
0
5
10
15
20
 
-2
-1
0
1
2
 
Inventors per Ten Thousand
3rd Grade Math Test Score (Standard Deviations Relative to Mean)
 
High-ability children much more
likely to become inventors if they
are from high-income families
 
U
p
w
a
r
d
 
M
o
b
i
l
i
t
y
 
a
n
d
 
E
c
o
n
o
m
i
c
 
G
r
o
w
t
h
 
Gaps in test scores grow rapidly as children grow older
 
Low income children fall further behind over time
 
 
Suggests that innovation gap may again be driven by
differences in childhood environments
 
 
Improving equality of opportunity could ultimately benefit
everyone, not just low-income families
 
1.
Local policies can also have large impacts on social
mobility.
 
Focus on specific cities such as Baltimore and on specific
neighborhoods within those cities
 
Target subsidized housing vouchers to families with young
children to help them move to better neighborhoods


P
o
l
i
c
y
 
L
e
s
s
o
n
s
 
1.
Local policies can also have large impacts on social
mobility.
 
 
2.
Improve childhood environments and primary education
 
Not just spending more money: US already spends more than
other developed countries with better outcomes
 
Instead, focus on key inputs such as attracting and retaining
talented teachers (e.g., Finland)
 
Childhood environment matters at all ages, not just the earliest
years
 
P
o
l
i
c
y
 
L
e
s
s
o
n
s
 
1.
Local policies can also have large impacts on social
mobility.
 
 
2.
Improve childhood environments and primary education
 
 
3.
Harness “big data” to develop a scientific evidence base
for economic and social policy
 
Identify which neighborhoods are in greatest need of
improvement and which policies work
 
“Precision medicine” for economic and social problems
 
P
o
l
i
c
y
 
L
e
s
s
o
n
s
Slide Note
Embed
Share

Explore the impact of neighborhood policies on equality through images and statistics depicting the American Dream's achievement probability in various countries, the geography of mobility in the United States, and the effects of moving to different neighborhoods on children's future incomes based on age at relocation.

  • Inequality
  • Opportunity
  • Neighborhoods
  • American Dream
  • Mobility

Uploaded on May 12, 2024 | 0 Views


Download Presentation

Please find below an Image/Link to download the presentation.

The content on the website is provided AS IS for your information and personal use only. It may not be sold, licensed, or shared on other websites without obtaining consent from the author. Download presentation by click this link. If you encounter any issues during the download, it is possible that the publisher has removed the file from their server.

E N D

Presentation Transcript


  1. Neighborhoods and Opportunity: Policies to Overcome Inequality John N. Friedman Brown University XX Insert photo from http://www.weisradio.com/wp-content/uploads/2013/06/education.jpg But make the image lower quality so that it takes up less memory and loads fater

  2. The American Dream? Probability that a child born to parents in the bottom fifth of the income distribution reaches the top fifth:

  3. The American Dream? Probability that a child born to parents in the bottom fifth of the income distribution reaches the top fifth: 7.5% USA Chetty, Hendren, Kline, Saez 2014 9.0% Blanden and Machin 2008 UK 11.7% Boserup, Kopczuk, and Kreiner 2013 Denmark Corak and Heisz 1999 13.5% Canada

  4. The American Dream? Probability that a child born to parents in the bottom fifth of the income distribution reaches the top fifth: 7.5% USA Chetty, Hendren, Kline, Saez 2014 9.0% Blanden and Machin 2008 UK 11.7% Boserup, Kopczuk, and Kreiner 2013 Denmark Corak and Heisz 1999 13.5% Canada Chances of achieving the American Dream are almost two times higher in Canada than in the U.S.

  5. The Geography of Upward Mobility in the United States Chances of Reaching the Top Fifth Starting from the Bottom Fifth by Metro Area Denver 8.7% Minneapolis 8.5% Milwaukee 4.5% Boston 10.4% San Jose 12.9% Washington DC 11.0% Charlotte 4.4% Atlanta 4.5% Salt Lake City 10.8% Dallas-Ft. Worth 7.1%

  6. Effects of Moving to a Different Neighborhood on a Child s Income in Adulthood by Age at Move 100% Dallas Percentage Gain from Moving to a Better Area 80% 60% 40% 20% Atlanta 0% 10 15 Age of Child when Parents Move 20 25 30

  7. Effects of Moving to a Different Neighborhood on a Child s Income in Adulthood by Age at Move 100% Dallas Percentage Gain from Moving to a Better Area 80% Children whose families move from Atlanta to Dallas when they are 9 years old get 54% of the gain from growing up in Dallas from birth 60% 40% 20% Atlanta 0% 10 15 Age of Child when Parents Move 20 25 30

  8. The Geography of Upward Mobility in the United States Causal Effects on Income for Poor Children, by County

  9. Causal Effects on Earnings for Children in Low-Income Families Top 10 and Bottom 10 Among the 100 Largest Counties in the U.S. Bottom 10 Counties Top 10 Counties Change in Earnings (%) Change in Earnings (%) County Rank County Rank +15.1 Pima, AZ -12.2 1 Dupage, IL 91 +14.4 -12.3 2 Snohomish, WA 92 Bronx, NY +14.1 -12.3 3 Bergen, NJ 93 Milwaukee, WI +13.3 -12.5 4 Bucks, PA 94 Wayne, MI +12.1 -12.9 5 Contra Costa, CA 95 Fresno, CA +12.1 -13.3 6 Fairfax, VA 96 Cook, IL +11.3 -13.5 7 King, WA 97 Orange, FL +10.8 -13.5 8 Norfolk, MA 98 Hillsborough, FL +10.5 -13.8 9 Montgomery, MD 99 Mecklenburg, NC +8.6 -17.3 10 Middlesex, NJ 100 Baltimore City, MD Estimates represent % change in adult earnings for 20 years of childhood spent in county

  10. Causal Effects on Earnings for Children in Low-Income Families Male Children Bottom 10 Counties Top 10 Counties Change in Earnings (%) Change in Earnings (%) County Rank County Rank 1 Bucks, PA 16.8 91 Milwaukee, WI -14.8 2 Bergen, NJ 16.6 92 New Haven, CT -15.0 3 Contra Costa, CA 14.5 93 Bronx, NY -15.2 4 Snohomish, WA 13.9 94 Hillsborough, FL -16.3 5 Norfolk, MA 12.4 95 Palm Beach, FL -16.5 6 Dupage, IL 12.2 96 Fresno, CA -16.8 7 King, WA 11.1 97 Riverside, CA -17.0 8 Ventura, CA 10.9 98 Wayne, MI -17.4 9 Hudson, NJ 10.4 99 Pima, AZ -23.0 10 Fairfax, VA 9.2 100 Baltimore City, MD -27.9 Estimates represent % change in adult earnings for 20 years of childhood spent in county

  11. The Geography of Upward Mobility in the United States For Children from Low-Income Families Dallas Metro: -2.7% (55th) Ft. Worth Metro: +3.7% (15th) Bryan County, OK Dallas County: -5.1% (66th) Tarrant County: +0.3% (38th) Johnson County: +18.0% Cooke Grayson Wise Denton Hunt Collin Hopkins Palo Pinto Parker Dallas Ft. Worth Rockwall Kaufman Hood Johnson Ellis Henderson Navarro Sommervell Note: Estimates represent change in rank from spending one more year of childhood in county. Counties colored by national deciles.

  12. The Geography of Upward Mobility in the United States For Children from High-Income Families Bryan County, OK Dallas County: +5.7% Tarrant County: +1.6% Johnson County: +6.2% Cooke Grayson Wise Denton Hunt Collin Hopkins Palo Pinto Parker Dallas Ft. Worth Rockwall Kaufman Hood Johnson Ellis Henderson Navarro Sommervell Note: Estimates represent change in rank from spending one more year of childhood in county. Counties colored by national deciles.

  13. What are the Characteristics of High-Mobility Areas? Five Strongest Correlates of Upward Mobility 1. Segregation Racial and income segregation associated with less mobility Long commute times (sprawl) associated with less mobility

  14. Racial Segregation in Milwaukee Whites (blue), Blacks (green), Asians (red), Hispanics (orange) Source: Cable (2013) based on Census 2010 data

  15. Racial Segregation in Sacramento Whites (blue), Blacks (green), Asians (red), Hispanics (orange) Source: Cable (2013) based on Census 2010 data

  16. Five Strongest Correlates of Upward Mobility 1. Segregation 2. Income Inequality Places with smaller middle class have much less mobility Upper tail inequality (top 1%) not strongly related to mobility

  17. Five Strongest Correlates of Upward Mobility 1. Segregation 2. Income Inequality 3. School Quality Higher expenditure, smaller classes, higher test scores correlated with more mobility

  18. Five Strongest Correlates of Upward Mobility 1. Segregation 2. Income Inequality 3. School Quality 4. Family Structure Areas with more single parents have much lower mobility Strong correlation even for kids whose own parents are married

  19. Five Strongest Correlates of Upward Mobility 1. Segregation 2. Income Inequality 3. School Quality 4. Family Structure 5. Social Capital It takes a village to raise a child Putnam (1995): Bowling Alone

  20. Correlates of Upward Mobility in Dallas and Fort Worth Share in Poverty Racial Segregation Income Inequality Fraction Single Moms Social Capital Student-Teacher Ratio -100 -75 -50 Percentile in the National Distribution Tarrant -25 0 25 50 75 100 Dallas

  21. Policies to Improve Upward Mobility What policy changes can improve mobility? Focus here on two types of policies suggested by correlations: 1. Reducing segregation: affordable housing policies 2. Improving education: teacher effectiveness

  22. Affordable Housing and Integration of Neighborhoods One way to increase integration: give low income families subsidized housing vouchers to move to better areas HUD Moving to Opportunity Experiment: gave such vouchers using a randomized lottery 4,600 families in Boston, New York, LA, Chicago, and Baltimore in mid 1990 s Source: Chetty, Hendren, and Katz 2016

  23. Common MTO Residential Locations in New York Experimental Wakefield Bronx Control ML King Towers Harlem

  24. Moving to Opportunity Experiment Children who moved to low-poverty areas when young (e.g., below age 13) do much better as adults: 30% higher earnings = $100,000 gain over life in present value 27% more likely to attend college 30% less likely to become single parents But moving had little effect on the outcomes of children who were already teenagers Moving also had no effect on parents earnings Reinforces conclusion that childhood exposure is a key determinant of upward mobility

  25. Housing Policy Implications Moving to a mixed-income neighborhood improves outcomes for low-income children Mixed-income neighborhoods produce, if anything, slightly better outcomes for the rich Integration could help the poor without hurting the rich

  26. Housing Policy: Limitations Subsidized housing vouchers and changes in urban planning could increase upward mobility, but there are limits to scalability Moving everyone in Harlem to Bronx is unlikely to help Ultimately need policies that improve existingneighborhoods rather than simply moving people around

  27. Using Big Data to Study Teachers Impacts School district records 2.5 million children 18 million test scores Tax records Earnings, College Attendance, Teen Birth Source: Chetty, Friedman, Hilger, Saez, Schanzenbach, Yagan 2011 Source: Chetty, Friedman, Rockoff 2014

  28. A Kindergarten Test I ll say a word to you. Listen for the ending sound. You circle the picture that starts with the same sound cup

  29. Correlation: Wage Earnings vs. Kindergarten Test Score $25K Mean Wage Earnings from Age 25-27 $20K $15K $10K 0 20 40 60 80 100 KG Test Score Percentile

  30. Causal Effect of Kindergarten Class Quality: Wage Earnings $18K +$875 per year Mean Wage Earnings from Age 25-27 $1 million NPV gains per classroom $17K $16K Above-Average Class Quality Below-Average Class Quality

  31. A Quasi-Experiment: Entry of High Quality Teacher 56 Entry of a Top 5% Teacher Average Test Score 54 52 50 93 94 95 96 97 98 School Year Scores in 4th Grade Scores in 3rd Grade

  32. A Quasi-Experiment: Entry of Low Quality Teacher 55 Entry of Bottom 5% Teacher 54 Average Test Score 53 52 51 50 93 94 95 96 97 98 School Year Scores in 4th Grade Scores in 3rd Grade

  33. The Value of Improving Teacher Quality 5th Median 95th Teacher Quality

  34. The Value of Improving Teacher Quality +$50,000 lifetime earnings per child = $1.4 million per classroom of 28 students 5th Median 95th Teacher Quality

  35. Equality of Opportunity and Economic Growth Traditional argument for greater social mobility is based on principles of justice But improving opportunities for upward mobility can also increase size of the economic pie One child s success need not come at another s expense To illustrate, focus on innovation Study the lives of 750,000 patent holders in the U.S. Source: Bell, Chetty, Jaravel, Petkova, van Reenen 2015

  36. Patent Rates vs. Parent Income Percentile 25 Patent rate for children with parents in top 1%: 22.5 per 10,000 20 Inventors per Ten Thousand 15 10 5 Patent rate for children with parents below median: 2.2 per 10,000 0 0 20 40 60 80 100 Parent Income Percentile

  37. Patent Rates vs. 3rd Grade Test Scores 20 85th Percentile Inventors per Ten Thousand 15 10 5 0 -2 -1 0 1 2 3rd Grade Math Test Score (Standard Deviations Relative to Mean)

  38. Patent Rates vs. 3rd Grade Test Scores for Children with Low vs. High Income Parents 20 High-ability children much more likely to become inventors if they are from high-income families Inventors per Ten Thousand 15 10 5 0 -2 -1 0 1 2 3rd Grade Math Test Score (Standard Deviations Relative to Mean) Parent Income Below Median Parent Income Above Median

  39. Upward Mobility and Economic Growth Gaps in test scores grow rapidly as children grow older Low income children fall further behind over time Suggests that innovation gap may again be driven by differences in childhood environments Improving equality of opportunity could ultimately benefit everyone, not just low-income families

  40. Policy Lessons 1. Local policies can also have large impacts on social mobility. Focus on specific cities such as Baltimore and on specific neighborhoods within those cities Target subsidized housing vouchers to families with young children to help them move to better neighborhoods

  41. Policy Lessons 1. Local policies can also have large impacts on social mobility. 2. Improve childhood environments and primary education Not just spending more money: US already spends more than other developed countries with better outcomes Instead, focus on key inputs such as attracting and retaining talented teachers (e.g., Finland) Childhood environment matters at all ages, not just the earliest years

  42. Policy Lessons 1. Local policies can also have large impacts on social mobility. 2. Improve childhood environments and primary education 3. Harness big data to develop a scientific evidence base for economic and social policy Identify which neighborhoods are in greatest need of improvement and which policies work Precision medicine for economic and social problems
Related


More Related Content

giItT1WQy@!-/#giItT1WQy@!-/#giItT1WQy@!-/#giItT1WQy@!-/#giItT1WQy@!-/#giItT1WQy@!-/#giItT1WQy@!-/#giItT1WQy@!-/#