Oklahoma Farmland Rental and Rates Update
This update provides information on dryland cropland values, cash rental rates, 2019 rental rates for non-irrigated cropland, average annual dryland cash rental rates for wheat, wheat monthly average price received by Oklahoma farmers, pasture values, and rental rates in Oklahoma. Insights on rental arrangements and rates are shared, offering valuable information for those interested in the agricultural sector. Data sources include USDA-NASS and OSU Agricultural Economics Department.

Download Presentation

Please find below an Image/Link to download the presentation.
The content on the website is provided AS IS for your information and personal use only. It may not be sold, licensed, or shared on other websites without obtaining consent from the author. If you encounter any issues during the download, it is possible that the publisher has removed the file from their server.
You are allowed to download the files provided on this website for personal or commercial use, subject to the condition that they are used lawfully. All files are the property of their respective owners.
The content on the website is provided AS IS for your information and personal use only. It may not be sold, licensed, or shared on other websites without obtaining consent from the author.
E N D
Presentation Transcript
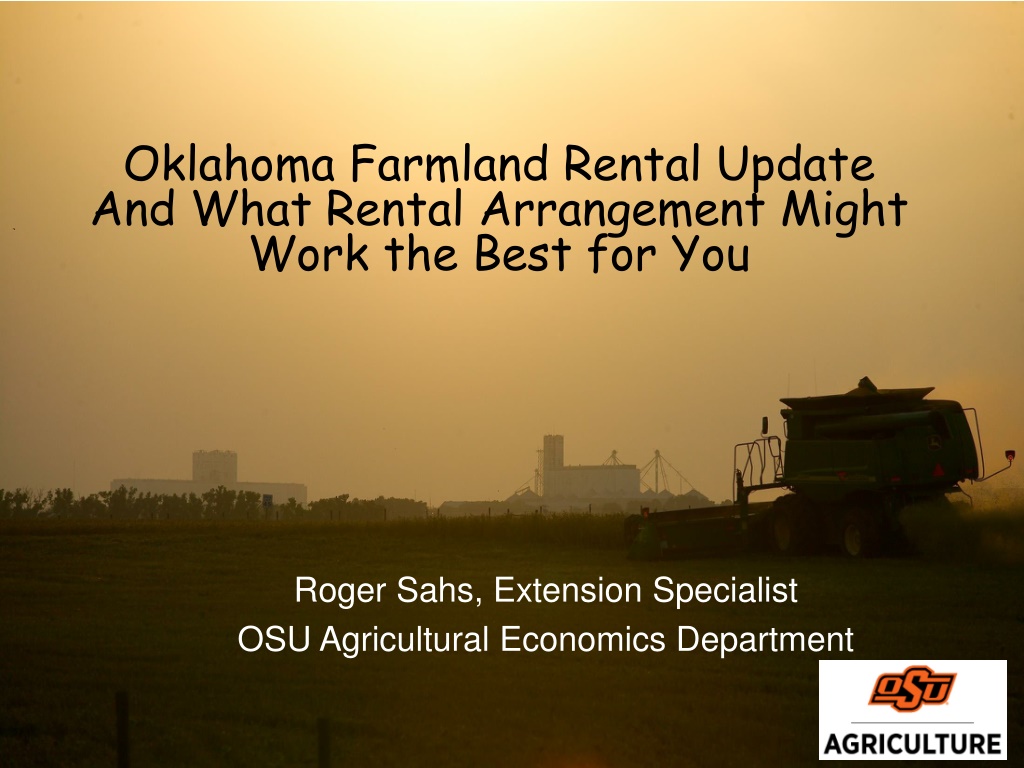
Oklahoma Farmland Rental Update And What Rental Arrangement Might Work the Best for You Roger Sahs, Extension Specialist OSU Agricultural Economics Department
Oklahoma Dryland Cropland Values and Rental Rates 1,800 35 1,600 30 1,400 Land Value ($/ac.) Cash Rent ($/ac) 25 1,200 20 1,000 800 15 600 10 400 5 200 0 0 OK Non-irrig Cropland Cash Rent USDA/NASS (http://quickstats.nass.usda.gov/)
2019 Rental Rates for Non-irrigated Cropland CIMARRON NOWATA WASHINGTON TEXAS HARPER BEAVER WOODS ALFALFA GRANT KAY CRAIG OSAGE * DELAWARE ROGERS WOODWARD NOBLE GARFIELD MAJOR * PAWNEE ELLIS MAYES PAYNE DEWEY WAGONER CREEK BLAINE LOGAN ROGER MILLS ADAIR LINCOLN MUSKOGEE CANADIAN CUSTER SEQUOYAH < $21 $21 to $27.50 OKFUSKEE * WASHITA MCINTOSH SEMINOLE BECKHAM * CADDO HUGHES PITTSBURG GRADY GREER $27.50 to $33 $33 + HARMON KIOWA LATIMER MCCLAIN GARVIN LE FLORE * COMANCHE JACKSON * * COAL STEPHENS TILLMAN MURRAY PUSHMATAHA * * * COTTON ATOKA JOHNSTON CARTER MARSHAL JEFFERSON MCCURTAIN CHOCTAW LOVE * BRYAN L Source: USDA-NASS * Indicates rate for Other (Combined) Counties
Average Annual Dryland Cash Rental Rates for Wheat ($/ac.) Wheat NW SW NC E State 2018 vs 2016 -9% 2018 mean Median 2016 mean 30.80 30.00 31.22 31.29 30.00 37.07 34.01 35.00 39.21 NA 32.90 33.00 36.01 30.75 Previous State Averages 2008 $33.14 2010 $31.78 2012 $32.80 2014 $35.54 2016 $36.01 North central East Northwest Southwest Source: OSU Current Report-230
Wheat Monthly Average Price Received by Oklahoma farmers during the marketing year 8 $6.58 1st half of decade 7 6 $5.10 2018/19 5 $/Bu. 4 $4.47 for 2020 harvest* 3 2 1 0 Avg. 10/11-14/15 2018/19 2019/20 * Forward contract price based on Feb 24 KC July wheat price minus 20 cent basis. Source: USDA-NASS
Oklahoma Pasture Values and Rental Rates 1,600 16 1,400 14 Cash Rent ($/ac.) Land Value ($/ac.) 1,200 12 1,000 10 800 8 600 6 400 4 200 2 0 0 Pasture Value Pasture Rent USDA/NASS (http://quickstats.nass.usda.gov/)
2019 Rental Rates for Pasture CIMARRO N NOWATA WASHINGTON TEXAS HARPER BEAVER WOODS ALFALFA GRANT KAY * * CRAIG OSAGE * DELAWARE ROGERS WOODWARD NOBLE GARFIELD * MAJOR PAWNEE ELLIS MAYES PAYNE DEWEY WAGONER * CREEK BLAINE LOGAN ROGER MILLS ADAIR LINCOLN MUSKOGE E CANADIAN CUSTER * SEQUOYAH < $12 $12 to $14.99 OKFUSKEE WASHITA * MCINTOSH SEMINOLE BECKHAM CADDO * HUGHES PITTSBURG GRADY GREER $15 to $16.99 $17 + HARMON KIOWA LATIMER MCCLAIN * GARVIN LE FLORE * COMANCHE * JACKSON COAL STEPHEN S TILLMAN MURRAY PUSHMATAH A COTTO N ATOKA JOHNSTON CARTER MARSHAL JEFFERSON MCCURTAIN CHOCTAW LOVE BRYAN L Source: USDA-NASS * Indicates rate for Other (Combined) Counties
Average Annual Pasture Cash Rental Rates ($/acre)* NW SW NC E State 2018 vs 2016 +10% Native Pasture 2016 11.61 10.00 10.94 NA NA NA 14.43 14.00 17.83 15.32 15.00 12.78 21.15 22.19 20.27 NA NA 17.40 16.76 15.00 13.95 25.22 20.00 24.55 20.40 20.00 NA 17.97 15.00 16.73 22.85 20.00 23.96 26.82 25.00 25.55 15.33 13.31 13.95 23.15 20.00 22.79 22.27 20.00 22.09 Bermuda +2% 2016 Other Pasture 2016 +1% North central Northwest * 2018 Average (black font) East 2018 Median (blue font) Southwest 2016 Average (red font) Source: OSU Current Report-216
What Rental Arrangement Might Work the Best for You? What portion of theincomedoI receive? What portion of the costsdo I contribute? What portion of the riskdo I bear? What crop and land management practices will be followed? What will be the condition of the land and improvements at the end of the lease?
Cash lease agreements Tenant pays landlord a fixed amount per acre per year. -$/acre or $/head for grass pasture -$/hd/day or $/cwt./mo. for grazing wheat/crop residues -$/acre for cropland May be single or multi-year in duration Can add flexible component.
Determining a Fair Cash Rent Market approach Landlord s costs plus return to equity Residual income method
Cash lease advantages Landlord More stable income Payment can be scheduled for any time of year Eliminates or greatly reduces cash expenditures Reduced management responsibility Shifts risk Fewer potential conflicts about sharing and marketing crops Tenant Total managerial freedom Fewer chances of conflict over decisions Receive all benefits of a good year and superior management Eliminates time and effort associated with dividing crops and input purchases as well as the related record keeping
Cash lease disadvantages Tenant Must shoulder all the price and yield risk if the agreement lacks flexibility Large capital requirements for inputs May be required to pay part of the rent early in the year before the crop is planted Landowners may attribute above average yields to soil rather than management Landlord Can become inequitable due to changes in prices, costs and technology Fewer opportunities for income tax management Will not realize benefits of good price and/or yield years if the agreement is not flexible Greater chance of soil depletion or overstocking pasture
Share lease agreements Landlord and tenant share proportionally in costs and risks of production, then share returns accordingly May be single or multi-year Typically 2/3 tenant crop share in OK $/lb. of gain on wheat pasture-production risk shared by pasture owner and cattle owner. Yield increasing inputs should be shared as the same percentage as returns.
Determining Equitable Share Arrangements Determine the percent contribution of total value of items contributed by each party, then . Share total returns in the same proportion as total expenses are contributed Adjust share arrangements to reflect the impact of new technologies, improvements, land quality Compensate tenant at the end of the lease for the unused portion of investments
Share lease advantages Landlord Receives benefits of good price and/or yield years Land and improvements are more likely to be maintained Tenant Less capital may be required Less experienced tenants can benefit from the landowner s managerial input Share price and yield risk with landowner
Share lease disadvantages Tenant Need to discuss management practices with landlord on a continuing basis Joint decisions result in more opportunities for conflicts Must share benefits of a good year and superior management Must maintain records of shared expenses and divide crops Landlord More variable income and increased risk Need to discuss management practices with tenant on a continuing basis Increased capital requirements associated with share of cash expenses Must maintain records of shared expenses Increased responsibilities More possibilities for conflicts with tenant
Put Your Agreement in Writing! Encourages understanding by both parties Serves as a reminder of terms agreed upon Legal resource and guide for heirs Serves as documentation for tax purposes Consult with a lawyer as needed!
Additional Resources OSU Fact Sheets and Current Reports: facts.okstate.edu for mobile-friendly version, http://factsheets.okstate.edu/ for pdfs Oklahoma Pasture Rental Rates, CR-216 Oklahoma Cropland Rental Rates, CR-230 Tax Aspects of Leasing, AGEC-940 More land rental information OSU ag land lease website: http://aglandlease.info/ NCFMC website: http://aglease101.org/ Kansas City Federal Reserve Bank https://www.kansascityfed.org/ USDA NASS https://www.nass.usda.gov/
Thanks for stopping by! Roger Sahs 520 Ag Hall 405/744-9836 roger.sahs@okstate.edu Survey link: https://okstatecasnr.az1.qualtrics.com/jfe/form/SV_8IhwW9CeEaQ6qfb


*")
*")