Observational Studies in Epidemiology


Observational studies in epidemiology: error, bias & confounding
MSc in International Health and Tropical Medicine 2015/2016
October 2015


Introduction to observational epidemiology
•
Typically NCDs evidence comes from observational epidemiology
ecological comparisons, cross-sectional analyses generate hypotheses
case-control studies and prospective cohort studies follow these to try to clarify associations
and establish causality
large scale prospective studies have established the most reliable evidence for many
associations in NCDs
ongoing prospective studies include biological samples for genetic & metabolomic analyses,
and often combine with other cohort studies in collaborative meta-analyses to increase power
•
Randomised trials in NCDs difficult (think of smoking exposure and heart disease; UV
exposure and skin cancer)
•
Observational epidemiology is useful but must be done with care

Learning outcomes
•
know about the contribution of observational epidemiology to international health
•
understand and define measurement error, bias and confounding
•
interpret observational studies and identify sources of error, bias and confounding
within these studies.
Observational epidemiology: study designs
case report, case series
ecological study
cross sectional analysis
case-control study
prospective cohort study
Case report, case series
Ecological study
definition
Cross-sectional analysis
Case-control study
An epidemiological study to identify causes of a disease or condition.
This is done by comparing a group of patients who have the disease or condition (cases) with a group of
people who do not have it (controls) but who are otherwise as similar as possible (in characteristics
thought to be unrelated to the causes of the disease or condition).
This means the researcher can look for aspects of their lives that differ to see if they may cause the
condition.
For example, a group of people with lung cancer might be compared with a group of people the same
age that do not have lung cancer. The researcher could compare how long both groups had been
exposed to tobacco smoke.
Case-control studies are retrospective because they look back in time from the outcome to the possible
causes of a disease or condition.
Adapted from NICE
https://www.nice.org.uk/glossary
Case control image of example
Case control study – how we analyse, what we get.
measures of association
What types of measures of association can we estimate from a case-control study?
Confidence intervals
The precision of an estimate of association between exposure and outcome is usually expressed as a
confidence interval (usually a 95% confidence interval).
The 95% confidence interval can be interpreted as the interval which, with a 95% certainty, holds the true
value of the association, assuming the study is not biased.
The wider the confidence interval, the greater uncertainty that we have precisely estimated the strength
of the association.
The width of the confidence interval is determined by the number of participants with the outcome of
interest, which in turn is determined by the sample size, so larger studies produce narrower CIs and
greater precision.
We can obtain a narrow confidence interval and yet have inaccurate results if our study is biased.
Cohort study
A study with 2 or more groups of people - cohorts - with similar characteristics.
One group receives a treatment, is exposed to a risk factor or has a particular symptom and the other
group does not.
The study follows their progress over time and records what happens.
For example, the EPIC-Oxford cohort study recruited vegetarians and non-vegetarians and followed
them over a number of years to compare disease rates between these groups
Adapted from NICE
https://www.nice.org.uk/glossary
Cohort study – how we analyse, what we get
Cohort study – further comments
What types of measures of association can we estimate from a cohort study?
Cohort studies: more types
Nested case-control studies
Mendelian randomisation studies
Observational epidemiology: study designs
General comments, the types of information we gain from different study types
Limits of observational studies
How observational studies differ from intervention studies
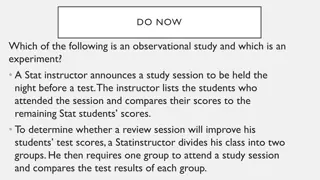
Practical task 1 (study design revision)
Look at these abstracts of published research papers. Some of them may have some details
blocked out.
Sort the abstracts into piles of different types of study e.g. prospective cohort study, cross-
sectional study.
If you identify an interventional study, keep that separate from the observational studies.
Work in small groups: task 1 (10 minutes)
Look at the print-outs we provide of the published research papers. Answer the following
questions about each:
1. What kind of observational study is this?
2. PECO:
-
What is the population group being investigated?
-
What is the exposure (factor of interest) being investigated?
-
What is the comparison group being used?
-
What is the outcome being investigated?
3. Why do you think this was the study type used? The authors might specify this, or you
might be left to deduce this from the research topic, setting or other features of the study.
Measurement error, bias and confounding
•
What these are
•
How these impact on observed associations
•
Some examples
•
Find our own examples
Random error
Random error
= random variation, or ‘noise in the system’.
•
Variability in human population means there is always some error, or ‘noise’ in gathering
information on the exposure, outcome, and any covariable information.
•
Greater random error leads to
lower precision in estimates of association/effect
wider confidence intervals (lower precision)
•
Random error can be reduced by large study sizes: bigger studies give more precise estimates
(narrower confidence intervals)
A small study – wide confidence intervals – low precision
Bias
Bias
= systematic error
Bias is an error in measuring or collecting information that differs systematically between groups of
participants. Bias can result from the design, conduct, or analysis of a study
Bias reduces the accuracy (validity) of estimates of effect/association
Bias can lead to over- or underestimating a true effect/association
•
Even when you have reduced random error (increased precision) by having a large study, bias can
still affect your results (as well as confounding and other problems).
•
Some examples: body size and MI risk
•
Now let’s look at some papers and find some examples
•
There are many types of bias. Some can be avoided by good study design. Always look out for biases,
even in randomised studies.
Bias in measuring body size – a paper looking at this.
Body size and mortality association – the impact of
bias in reporting height and weight
•
Look at this association of BMI and mortality
•
Now look at this information on how individuals tend to report their height and weight:
Individuals under-report their BMI (by underestimating weight and overestimating height),
unless their BMI is low
•
If these biases are present in the BMI-mortality study, what might the impact be on the reported
results?
•
Now let’s look at some more papers and find our own examples
Think of some other possible sources of bias in observational studies.
Confounding
Confounding occurs when the effect of an exposure/intervention on an outcome is distorted as a
result of an association between the population or intervention or outcome and another factor (the
'confounding variable' or 'confounder') that can influence the outcome independently of the
exposure/intervention under investigation.
From NICE
https://www.nice.org.uk/glossary
Confounding
Confounding factor
= a characteristic that can cause or prevent the disease and is also associated with the
exposure of interest.
An observational study aims to identify the effect of an exposure. Sometimes the apparent association
with an exposure is actually an association with another factor which is associated with the exposure and
with the outcome.
This other factor is a confounder, provided that it is not an intermediate step between the exposure and
the outcome (e.g. high blood pressure is an intermediate step between obesity and CVD, rather than being
a confounder).
•
How confounding impacts on observed associations
-
Confounding can elevate, reduce or reverse an observed association
Confounding continued.
-
difficult to avoid in observational studies as unknown confounders may always be present
-
an RCT uses randomisation to deal with both known and unknown factors that may differ between
exposed and unexposed groups
Example
•
In your prospective study, you observe that saccharin intake is associated with increased risk of kidney
cancer. Obesity is established to increase risk of kidney cancer. Could saccharin intake be a confounder?
It can be difficult to identify confounding. If a factor is an intermediate on a causal pathway (e.g. if obesity
causes raised blood pressure which then causes CVD) then adjusting for it will take away a genuine
association.
There may always be confounders we are not aware of
•
Now let’s look at some papers and find our own examples
Illustration of confounding
Effect modification
Illustration of effect modification
Approaches to deal with confounding
Study design
randomisation to deal with known and unknown confounders
not available in observational studies
Mendelian randomisation studies
In the analysis
•
Stratification: stratify by levels of the confounding variable
•
Multiple confounders this is difficult for
•
Multivariable analysis
•
Adjustment in regression models to control for potential confounders
Reverse causality – another type of bias
•
The outcome might be causally related (partially or wholly) to the exposure
•
The observed association will be inaccurate, sometimes completely in the wrong direction.
Example
We might observe in a case-control study of pancreatic cancer risk that participants with lower
body weight had lower odds of pancreatic cancer than those with higher body weight.
However, pancreatic cancer can cause weight loss, often before cancer is diagnosed.
To avoid this reverse causation bias, we might perform a prospective study in which BMI is recorded
at enrolment and the association with pancreatic cancer risk examined several years later. This may
reveal that those with higher BMI had increased risk of pancreatic cancer compared with those
with lower BMI.
Looking out for measurement error, bias and
confounding
•
Looking at more examples and discussing; directing to further reading
•
When designing observational studies, plan strategies to reduce errors and biases
•
RCTs aim to eradicate bias but they are still subject to many biases, see further
reading
•
In practice we will often be working with evidence influenced by measurement error,
bias and confounding
Work in small groups: task 2 (15 minutes)
Each small group will be given copies of a research paper.
We are trying to develop an awareness of the error, bias, confounding within observational
studies.
Can you identify any problems with this study? Some examples might be:
-
Study seems too small – confidence intervals are very wide
-
The reported associations seem implausible biologically
-
What is reported in the abstract is not representative of what the full results section
shows
-
the wrong type of study design was used to try to answer this research question
-
The study does not mention the possibility of confounding
Biases we found
Note on the flip pad
EPIC
Establishing causality
Rule out random error
Rule out bias
Deal with confounding
Valid association
•
Check causality criteria
sequence in time
strength of association
consistency of association between studies
presence of a dose response association
specificity of association
biological plausibility
experimental evidence
Measures of disease frequency
•
D
ifference between rate and risk
•
OR, HR
Questions to consider
•
Can epidemiological studies be wrong?
•
How can we know when a study result is incorrect?
Additional information: definitions
Epidemiology
the study of the causes, distribution, control and prevention of disease
Risk
probability that an event will occur = no. new cases in time period/no. disease free
participants at start of time period
Rate
no. new cases in a defined time period/ total person-time at risk
Relative risk (RR)
risk in exposed group divided by risk in unexposed group
Odds ratio (OR)
odds in exposed group divided by odds in unexposed group
Absolute risk reduction/Risk difference
risk in exposed group minus risk in unexposed group
NNT
number needed to treat = 1/ARR
P value
indicates whether an effect is statistically significant.
P value <0.01 indicates less than a 1% probability that the results occurred by chance
Reliability
the ability to obtain the same result each time a study is repeated with a different
population or group.
Adapted from NICE
https://www.nice.org.uk/glossary
Confidence interval
The confidence interval (CI) indicates how certain we are about an estimate: the CI gives a range
that is likely to include the 'true' value for the population.
Typically the 95%CI is reported, indicating that the range of values has a 95 in a 100 chance of
including the 'true' value.
A wide confidence interval indicates a lack of certainty about the true estimate, often due to a small
sample size. A narrow confidence interval indicates a more precise estimate, e.g. if a large sample
size used.
P values
p value = the probability that the results would be as observed, if the null hypothesis were true.
The null hypothesis, set up to be disproved, usually states that an exposure has no effect on the outcome.
P<0.001
less than 1 in 1000 chance of being wrong
P<0.01
less than 1 in 100 chance of being wrong
P<0.05
less than 1 in 20 chance of being wrong
If you perform 20 tests, you would expect 1 of these (on average) to produce a “significant” p value of P<0.05, purely by
chance. When a study reports a large number of p values, some of these will appear statistically significant just by chance.
The p value needs to be interpreted alongside the size of the observed association and its confidence interval, the biological
plausibility of such an association, and what you know of the study’s design, conduct and analysis.
Looking a study’s results, some associations may be statistically significant but have no relevance.
Some associations may be important but fail to achieve a statistical significant p value in that study.
The p value depends on the sample size. Large studies will produce associations with “significant” p values just by chance.
P values must be interpreted with caution, clinical knowledge and common sense.
Risk
The probability that an event will occur
• Relates the number of new cases to the size of the population at risk in the beginning of the time
period studied
= Number of new cases in a defined time period/Number of disease free people at the beginning
of the time period
Rate
= Number of new cases in a defined time period/Total person-time at risk during the follow-up period
Person-time is a measure that takes into account changes in the size of the population at risk during
the follow-up period
For each study participant, time at risk is the time from enrolment until the earliest of:
a) they develop the outcome
b) they become lost to follow-up
c) the study ends
Non-differential (random) misclassification occurs when classifications of disease status or
exposure occurs equally in all study groups being compared.
Non-differential misclassification increases the similarity between the exposed and non-exposed
groups, and may result in an
underestimate
(dilution) of the true strength of an association
between exposure and disease.
Differential (non-random) misclassification occurs when the proportions of subjects misclassified
differ between the study groups – it is a systematic error and therefore a
bias
. The observed
estimate of association/effect can be
overestimated or underestimated
.
Validity
Internal validity: study measured what it set out to do
External validity: ability to generalise beyond the study population
Standardised mortality rates
Death rate (crude) =
No. deaths during a specified period of time
No. population at risk during a specified period of time
Standardised mortality rate (SMR)
Standardisation is used when comparing mortality in two population groups
with different demographic structures, to remove the effect of differences in age (or other confounding variables
that affect mortality rate) between the population groups.
Standardisation can be either direct, giving an Age-Standardized Mortality Rate; or indirect, producing a Standardized
Mortality Ratio (SMR).
Standardized mortality ratio
– (an indirect standardisation) -
The standardized mortality ratio is the ratio of observed deaths in the study group to expected deaths in the general
population.
This ratio can be expressed as a percentage simply by multiplying by 100.
It is an indirect form of standardisation.
An alternative is age-standardised mortality rate.
Standardized mortality rate
Standardized mortality rate
tells how many persons, per thousand of the population, will die in a given year and
what the causes of death will be.
(
https://en.wikipedia.org/wiki/Standardized_mortality_ratio
Wikipedia, accessed 11 October 2015)
NCDs
NCDs kill 38 million people each year.
Almost three quarters of NCD deaths - 28 million - occur in LMICs.
16 million NCD deaths occur before the age of 70; 82% of these "premature" deaths occurred in LMICs
By 2020 NCDs predicted to cause 70% deaths in developing regions, compared with <50% currently
Tobacco use, physical inactivity, the harmful use of alcohol and unhealthy diets all increase the risk of
dying from an NCD.
Many premature NCD deaths are preventable.
http://www.who.int/mediacentre/factsheets/fs355/en/
http://www.who.int/nmh/publications/ncd-profiles-2014/en/
http://www.thelancet.com/journals/lancet/article/PIIS0140-6736%2812%2961766-8/abstract
In 1997
52.2 million deaths globally
24.4 million deaths due to NCDs
15.3 million circulatory diseases
6.2 million cancer
2.9 million respiratory diseases
3.6 million were due to perinatal conditions
17.3 million were due to infectious and parasitic diseases
3.7 million acute lower respiratory infections
2.9 million tuberculosis
2.5 million diarrhoea
2.3 million HIV/AIDS
1.5-2.7 million malaria
WHO World Health Report
http://www.who.int/whr/1998/media_centre/50facts/en/
In 2012
56 million deaths globally
38 million deaths due to NCDs
17.5 million cardiovascular diseases
8.2 million cancer
4 million respiratory diseases
1.5 million diabetes
(contemporary data for perinatal deaths not available from WHO)
8.2 million due to infectious and parasitic diseases
3.1 million acute lower respiratory infections
~1.5 million tuberculosis
1.5 million diarrhoea
1.5 million HIV/AIDS
~600,000 malaria
http://www.who.int/gho/ncd/mortality_morbidity/en/
http://www.who.int/mediacentre/factsheets/fs310/en/
http://www.who.int/mediacentre/factsheets/fs355/en/
apps.who.int/iris/bitstream/10665/112738/1/9789240692671_eng.pdf
Introduce observational studies
Their design, importance in global health
How to recognise and interpret these
The limits and problems in using observational data
Revision:
Why do we need epidemiology?
What are its central aims?
To give us evidence to properly practice medicine, health care, and public health.
A fundamental application is to explain patterns of disease occurrence and identify causal associations between exposures and outcomes.
- Does passive smoking increase the risk of miscarriage?
- Does a daily low dose of aspirin reduce the risk of heart attacks?
- Does eating vegetables prevent dementia?
Delve into the realm of observational studies in epidemiology, exploring concepts such as error, bias, and confounding. Discover the significance of various study designs, from case reports to prospective cohort studies, in elucidating associations and establishing causality in non-communicable diseases (NCDs). Gain insights into measurement error, bias, and confounding, and learn to interpret observational studies effectively while identifying sources of error within them.

Download Presentation

Please find below an Image/Link to download the presentation.
The content on the website is provided AS IS for your information and personal use only. It may not be sold, licensed, or shared on other websites without obtaining consent from the author.If you encounter any issues during the download, it is possible that the publisher has removed the file from their server.
You are allowed to download the files provided on this website for personal or commercial use, subject to the condition that they are used lawfully. All files are the property of their respective owners.
The content on the website is provided AS IS for your information and personal use only. It may not be sold, licensed, or shared on other websites without obtaining consent from the author.
E N D
Presentation Transcript
Observational studies in epidemiology: error, bias & confounding MSc in International Health and Tropical Medicine 2015/2016 October 2015
Introduction to observational epidemiology Typically NCDs evidence comes from observational epidemiology ecological comparisons, cross-sectional analyses generate hypotheses case-control studies and prospective cohort studies follow these to try to clarify associations and establish causality large scale prospective studies have established the most reliable evidence for many associations in NCDs ongoing prospective studies include biological samples for genetic & metabolomic analyses, and often combine with other cohort studies in collaborative meta-analyses to increase power Randomised trials in NCDs difficult (think of smoking exposure and heart disease; UV exposure and skin cancer) Observational epidemiology is useful but must be done with care
Learning outcomes know about the contribution of observational epidemiology to international health understand and define measurement error, bias and confounding interpret observational studies and identify sources of error, bias and confounding within these studies.
Observational epidemiology: study designs case report, case series ecological study cross sectional analysis case-control study prospective cohort study
Ecological study definition
Case-control study An epidemiological study to identify causes of a disease or condition. This is done by comparing a group of patients who have the disease or condition (cases) with a group of people who do not have it (controls) but who are otherwise as similar as possible (in characteristics thought to be unrelated to the causes of the disease or condition). This means the researcher can look for aspects of their lives that differ to see if they may cause the condition. For example, a group of people with lung cancer might be compared with a group of people the same age that do not have lung cancer. The researcher could compare how long both groups had been exposed to tobacco smoke. Case-control studies are retrospective because they look back in time from the outcome to the possible causes of a disease or condition. Adapted from NICE https://www.nice.org.uk/glossary
Case control study how we analyse, what we get. measures of association What types of measures of association can we estimate from a case-control study?
Confidence intervals The precision of an estimate of association between exposure and outcome is usually expressed as a confidence interval (usually a 95% confidence interval). The 95% confidence interval can be interpreted as the interval which, with a 95% certainty, holds the true value of the association, assuming the study is not biased. The wider the confidence interval, the greater uncertainty that we have precisely estimated the strength of the association. The width of the confidence interval is determined by the number of participants with the outcome of interest, which in turn is determined by the sample size, so larger studies produce narrower CIs and greater precision. We can obtain a narrow confidence interval and yet have inaccurate results if our study is biased.
Cohort study A study with 2 or more groups of people - cohorts - with similar characteristics. One group receives a treatment, is exposed to a risk factor or has a particular symptom and the other group does not. The study follows their progress over time and records what happens. For example, the EPIC-Oxford cohort study recruited vegetarians and non-vegetarians and followed them over a number of years to compare disease rates between these groups Adapted from NICE https://www.nice.org.uk/glossary
Cohort study further comments What types of measures of association can we estimate from a cohort study?
Cohort studies: more types Nested case-control studies Mendelian randomisation studies
Observational epidemiology: study designs General comments, the types of information we gain from different study types Limits of observational studies How observational studies differ from intervention studies
Practical task 1 (study design revision) Look at these abstracts of published research papers. Some of them may have some details blocked out. Sort the abstracts into piles of different types of study e.g. prospective cohort study, cross- sectional study. If you identify an interventional study, keep that separate from the observational studies.
Work in small groups: task 1 (10 minutes) Look at the print-outs we provide of the published research papers. Answer the following questions about each: 1. What kind of observational study is this? 2. PECO: - What is the population group being investigated? - What is the exposure (factor of interest) being investigated? - What is the comparison group being used? - What is the outcome being investigated? 3. Why do you think this was the study type used? The authors might specify this, or you might be left to deduce this from the research topic, setting or other features of the study.
Measurement error, bias and confounding What these are How these impact on observed associations Some examples Find our own examples
Random error Random error= random variation, or noise in the system . Variability in human population means there is always some error, or noise in gathering information on the exposure, outcome, and any covariable information. Greater random error leads to lower precision in estimates of association/effect wider confidence intervals (lower precision) Random error can be reduced by large study sizes: bigger studies give more precise estimates (narrower confidence intervals)
Bias Bias = systematic error Bias is an error in measuring or collecting information that differs systematically between groups of participants. Bias can result from the design, conduct, or analysis of a study Bias reduces the accuracy (validity) of estimates of effect/association Bias can lead to over- or underestimating a true effect/association Even when you have reduced random error (increased precision) by having a large study, bias can still affect your results (as well as confounding and other problems). Some examples: body size and MI risk Now let s look at some papers and find some examples There are many types of bias. Some can be avoided by good study design. Always look out for biases, even in randomised studies.
Body size and mortality association the impact of bias in reporting height and weight Look at this association of BMI and mortality Now look at this information on how individuals tend to report their height and weight: Individuals under-report their BMI (by underestimating weight and overestimating height), unless their BMI is low If these biases are present in the BMI-mortality study, what might the impact be on the reported results? Now let s look at some more papers and find our own examples
Types of bias Example Example in context Potential impact on observed association Selection bias Participants in a prospective study differ systematically from people who do not participate in the prospective study. Participants in EPIC-Oxford have lower mortality rates than general UK population Measurement error biases An incorrect blood pressure measurement device used in one group and a correct device used in another People who drink more alcohol under-report their intake by more than people who drink less alcohol Recall bias Participants with diagnosed brain cancer in a case control study recall greater mobile phone use than participants without diagnosed brain cancer Bias in losses to follow- up Participants in a prospective study who continue to smoke less likely to return a questionnaire about smoking Think of some other possible sources of bias in observational studies.
Confounding Confounding occurs when the effect of an exposure/intervention on an outcome is distorted as a result of an association between the population or intervention or outcome and another factor (the 'confounding variable' or 'confounder') that can influence the outcome independently of the exposure/intervention under investigation. From NICE https://www.nice.org.uk/glossary
Confounding Confounding factor = a characteristic that can cause or prevent the disease and is also associated with the exposure of interest. An observational study aims to identify the effect of an exposure. Sometimes the apparent association with an exposure is actually an association with another factor which is associated with the exposure and with the outcome. This other factor is a confounder, provided that it is not an intermediate step between the exposure and the outcome (e.g. high blood pressure is an intermediate step between obesity and CVD, rather than being a confounder). How confounding impacts on observed associations - Confounding can elevate, reduce or reverse an observed association
Confounding continued. - difficult to avoid in observational studies as unknown confounders may always be present - an RCT uses randomisation to deal with both known and unknown factors that may differ between exposed and unexposed groups Example In your prospective study, you observe that saccharin intake is associated with increased risk of kidney cancer. Obesity is established to increase risk of kidney cancer. Could saccharin intake be a confounder? It can be difficult to identify confounding. If a factor is an intermediate on a causal pathway (e.g. if obesity causes raised blood pressure which then causes CVD) then adjusting for it will take away a genuine association. There may always be confounders we are not aware of Now let s look at some papers and find our own examples
Approaches to deal with confounding Study design randomisation to deal with known and unknown confounders not available in observational studies Mendelian randomisation studies In the analysis Stratification: stratify by levels of the confounding variable Multiple confounders this is difficult for Multivariable analysis Adjustment in regression models to control for potential confounders
Reverse causality another type of bias The outcome might be causally related (partially or wholly) to the exposure The observed association will be inaccurate, sometimes completely in the wrong direction. Example We might observe in a case-control study of pancreatic cancer risk that participants with lower body weight had lower odds of pancreatic cancer than those with higher body weight. However, pancreatic cancer can cause weight loss, often before cancer is diagnosed. To avoid this reverse causation bias, we might perform a prospective study in which BMI is recorded at enrolment and the association with pancreatic cancer risk examined several years later. This may reveal that those with higher BMI had increased risk of pancreatic cancer compared with those with lower BMI.
Looking out for measurement error, bias and confounding Looking at more examples and discussing; directing to further reading When designing observational studies, plan strategies to reduce errors and biases RCTs aim to eradicate bias but they are still subject to many biases, see further reading In practice we will often be working with evidence influenced by measurement error, bias and confounding
Work in small groups: task 2 (15 minutes) Each small group will be given copies of a research paper. We are trying to develop an awareness of the error, bias, confounding within observational studies. Can you identify any problems with this study? Some examples might be: - Study seems too small confidence intervals are very wide - The reported associations seem implausible biologically - What is reported in the abstract is not representative of what the full results section shows - the wrong type of study design was used to try to answer this research question - The study does not mention the possibility of confounding
Biases we found Note on the flip pad
Establishing causality Rule out random error Rule out bias Deal with confounding Valid association Check causality criteria sequence in time strength of association consistency of association between studies presence of a dose response association specificity of association biological plausibility experimental evidence
Measures of disease frequency Difference between rate and risk OR, HR
Questions to consider Can epidemiological studies be wrong? How can we know when a study result is incorrect?
Additional information: definitions Epidemiology the study of the causes, distribution, control and prevention of disease Risk probability that an event will occur = no. new cases in time period/no. disease free participants at start of time period Rate no. new cases in a defined time period/ total person-time at risk Relative risk (RR) risk in exposed group divided by risk in unexposed group Odds ratio (OR) odds in exposed group divided by odds in unexposed group Absolute risk reduction/Risk difference risk in exposed group minus risk in unexposed group NNT number needed to treat = 1/ARR P value indicates whether an effect is statistically significant. P value <0.01 indicates less than a 1% probability that the results occurred by chance Reliability the ability to obtain the same result each time a study is repeated with a different population or group.
Confidence interval The confidence interval (CI) indicates how certain we are about an estimate: the CI gives a range that is likely to include the 'true' value for the population. Typically the 95%CI is reported, indicating that the range of values has a 95 in a 100 chance of including the 'true' value. A wide confidence interval indicates a lack of certainty about the true estimate, often due to a small sample size. A narrow confidence interval indicates a more precise estimate, e.g. if a large sample size used.
P values p value = the probability that the results would be as observed, if the null hypothesis were true. The null hypothesis, set up to be disproved, usually states that an exposure has no effect on the outcome. P<0.001 P<0.01 P<0.05 less than 1 in 1000 chance of being wrong less than 1 in 100 chance of being wrong less than 1 in 20 chance of being wrong If you perform 20 tests, you would expect 1 of these (on average) to produce a significant p value of P<0.05, purely by chance. When a study reports a large number of p values, some of these will appear statistically significant just by chance. The p value needs to be interpreted alongside the size of the observed association and its confidence interval, the biological plausibility of such an association, and what you know of the study s design, conduct and analysis. Looking a study s results, some associations may be statistically significant but have no relevance. Some associations may be important but fail to achieve a statistical significant p value in that study. The p value depends on the sample size. Large studies will produce associations with significant p values just by chance. P values must be interpreted with caution, clinical knowledge and common sense.


")
")


")