NYC 2013 Health Survey: Eating Habits by Income, Poverty Rate, Race/Ethnicity & Education
Analyzing age-adjusted prevalence of eating 5 or more servings of fruits and vegetables per day in NYC in 2013 based on family income, zip code poverty rate, race/ethnicity, and education levels. The data provides insights into disparities in healthy eating habits across different socio-economic groups.
Download Presentation

Please find below an Image/Link to download the presentation.
The content on the website is provided AS IS for your information and personal use only. It may not be sold, licensed, or shared on other websites without obtaining consent from the author.If you encounter any issues during the download, it is possible that the publisher has removed the file from their server.
You are allowed to download the files provided on this website for personal or commercial use, subject to the condition that they are used lawfully. All files are the property of their respective owners.
The content on the website is provided AS IS for your information and personal use only. It may not be sold, licensed, or shared on other websites without obtaining consent from the author.
E N D
Presentation Transcript
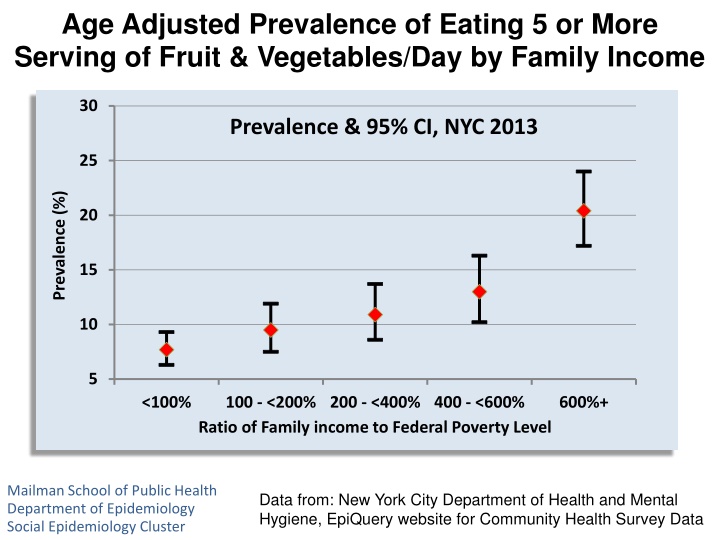
Age Adjusted Prevalence of Eating 5 or More Serving of Fruit & Vegetables/Day by Family Income 30 Prevalence & 95% CI, NYC 2013 25 Prevalence (%) 20 15 10 5 <100% 100 - <200% 200 - <400% 400 - <600% Ratio of Family income to Federal Poverty Level 600%+ Mailman School of Public Health Department of Epidemiology Social Epidemiology Cluster Data from: New York City Department of Health and Mental Hygiene, EpiQuery website for Community Health Survey Data
Age Adjusted Prevalence of Eating 5 or More Serving of Fruit & Vegetables/Day by Zip Code Poverty Rate 30 Prevalence & 95% CI, NYC 2013 25 Prevalence (%) 20 15 10 5 <10% 10 - 19% 20 - 29% 30%+ Percent of Families Living Below the Federal Poverty Level Mailman School of Public Health Department of Epidemiology Social Epidemiology Cluster Data from: New York City Department of Health and Mental Hygiene, EpiQuery website for Community Health Survey Data
Age Adjusted Prevalence of Eating 5 or More Serving of Fruit & Vegetables/Day by Race/Ethnicity 30 Prevalence & 95% CI, NYC 2013 25 Prevalence (%) 20 15 10 5 0 White Non- Hispanic Black Non- Hispanic Hispanic Asian/Pacific Islander Mailman School of Public Health Department of Epidemiology Social Epidemiology Cluster Data from: New York City Department of Health and Mental Hygiene, EpiQuery website for Community Health Survey Data
Age Adjusted Prevalence Eating 5 or More Serving of Fruit & Vegetables/Day by Education 30 Prevalence & 95% CI, NYC 2013 25 Prevalence (%) 20 15 10 5 0 Less than high school High school Some college College Mailman School of Public Health Department of Epidemiology Social Epidemiology Cluster Data from: New York City Department of Health and Mental Hygiene, EpiQuery website for Community Health Survey Data
