Nuclear and Renewables in Deregulated Markets: Fuel Cycle Cost Estimates and Policy Options
Laboratoire d'Economie et Management Nantes-Atlantique study on capacity management, fuel cost factors, and market dynamics in nuclear and renewable energy sectors. Case study explores load-following impacts on uranium cycle. Discussion on centralized vs. decentralized market designs in the U.S. and Europe. Insights on future power market challenges due to technological constraints.
Download Presentation

Please find below an Image/Link to download the presentation.
The content on the website is provided AS IS for your information and personal use only. It may not be sold, licensed, or shared on other websites without obtaining consent from the author.If you encounter any issues during the download, it is possible that the publisher has removed the file from their server.
You are allowed to download the files provided on this website for personal or commercial use, subject to the condition that they are used lawfully. All files are the property of their respective owners.
The content on the website is provided AS IS for your information and personal use only. It may not be sold, licensed, or shared on other websites without obtaining consent from the author.
E N D
Presentation Transcript
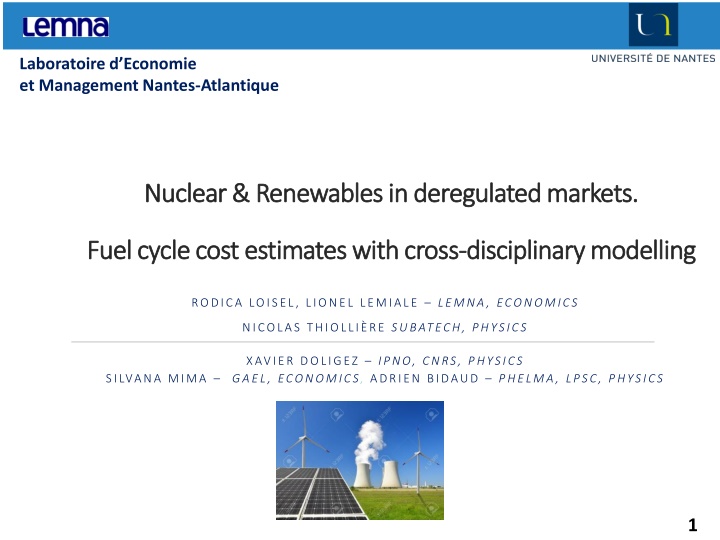
Laboratoire dEconomie et Management Nantes-Atlantique Nuclear & Renewables in deregulated markets. Nuclear & Renewables in deregulated markets. Fuel cycle cost estimates with cross Fuel cycle cost estimates with cross- -disciplinary modelling disciplinary modelling RODICA LOISEL, LIONEL LEMIALE LEMNA, ECONOMICS NICOLAS THIOLLI RE SUBATECH, PHYSICS XAVIER DOLIGEZ IPNO, CNRS, PHYSICS GAEL, ECONOMICS, ADRIEN BIDAUD PHELMA, LPSC, PHYSICS SILVANA MIMA 1 1
Context: Context: Role of Capacity management and the fuel Capacity Factor fuel cost Factor anticipation anticipation in the fuel cost estimates estimates Nuclear O&M Fuel management: complex relationship Long-term CAPEX: Investment planning decision, target policies Nuc Capacity Short-term VOM+Fuel_cost: Interaction with other technologies Capacity Factor ??????? = ???? ?????+ ???????????+ ???????????? ????+ ???????????? Market factors affecting the nuclear fuel cycle: capacity factor CF license cycling operational cost frequency + cost of safety measures refurbishment/ upgrading EO. 2 2
Case Study Methodology Results Policy options How nuclear power plants operating load-following affects the dynamics of the uranium cycle under cost-efficiency considerations? Agenda Agenda 1. Case study Electricity pricing in future power markets 2. Methodology Pluridisciplinarity: Class-Poles-EcoNUK Dispatching nuclear reactors and renewables 3. Results Projections to 2030 4. Policy options 3 3
Case Study Methodology Results Policy options Decentralized Decentralized market market design. design. Definition Definition Centralized market (USA) : a market operator (=TSO) has the authority to make binding operating decisions for generation units, based on their marginal cost. Decentralized market design (Europe): generating firms determine when to have units online and submit offers based on their declared costs. Offers are allowed to be above / below marginal costs. To prevent uncompetitive behaviour, regulators can use obligations to deliver (to be online), price caps or market monitoring to limit the exercise of market power. 4 4
Case Study Methodology Results Policy options How future power How future power markets nuclear nuclear technological technological constraints markets will will account account for constraints? ? for Current decentralized market design: Energy only: separate clearing of services Zonal prices Gate closure CET 12:00 Economic dispatch of generators TSO: role of market facilitator Individual generating firms have to manage themselves constraints and internalize non-convex operating costs: Ramping costs, minimum load levels, start-up / shutdown costs. operational 5 5
Cycling Methodology Results Policy options Merit order curve and Inframarginal Rent When the nuclear power is price-taker, the infra-marginal rent is shared among: Capex Opex Load-Following cost (if any) Upgrading CAPEX (if any). Merit order curve in 2030 300 256.82 250 175.90 200 /MWh 150 116.56 RENT 100 52.18 50 22.05 1.72 1.72 0.08 0.08 0.08 0.10 0.10 0.10 0.10 0 6 6
Cycling Methodology Results Policy options How to recover Load-Following costs? When the nuclear power is price-maker, it could recover additional costs (< CostTech +1): Including Load-Following cost into VOM would make increase the nuclear marginal cost. The market price would increase, the inframarginal rent of units online increase too. Consumer surplus will decrease. Merit order curve in 2030 300 256.82 250 200 175.90 /MWh 150 116.56 100 UP 52.18 50 22.05 1.72 1.72 0.08 0.08 0.08 0.10 0.10 0.10 0.10 0 7 7
Case Study Methodology Results Policy options Pluridisciplinarity Pluridisciplinarity: : Physics Economics Regulation 8
Case Study Methodology Results Policy options CLASS) )Fuel Cycle simulation Physics Physics ( (CLASS 9
Case Study Methodology Results Policy options Poles) )2 C Scenario 2100 description Macroeconomics Macroeconomics ( (Poles Prospective Outlook on Long-term Energy Systems Simulation for France, 2030, ~10 MtCO2 elec Elec Capacity Annual Generation by technology Annual Demand Annual Net Exports 10 10 https://ec.europa.eu/jrc/en/poles/model
Case Study Methodology Results Policy options Poles Climate Policy Scenario 2030 (190 2005/tCO2) Data on the technology mix, power generation, demand, net exports in 2030 Capacity MW 57 018 4 178 10 327 8 277 13 156 24 786 12 393 8 993 39 683 7 518 37 682 4 429 228 440 30 000 492 630 84 451 86 562 59% 82% 34% 127 278 Generation GWh 404 247 15 979 12 807 11 440 50 736 93 133 22 799 53 388 13 104 685 671 CF % VOM Total /MWh Technology 81% 6% 18% 18% 0% 5% 5% 64% 27% 35% 16% 34% 34% 22 176 0.1 Nuclear Coal Hydro River Hydro Lake Oil steam turbine CCGT Combined cycles gas turbines NGGT Natural gas gas turbines Biomass Wind On-shore Wind Off-shore Solar Other RES Total Capacity, MW Connections Imports, MW National Demand, GWh Net Exports, GWh Losses, GWh NUC / Total Generation NUC / Demand Variable RES / Demand Peak D+X+P, MW 2 317 3 - 257 130 117 52 0.1 0.1 0.1 0.1 5 720 Merit order curve in 2030, based on VOM Total from Poles 300 256.82 250 175.90 200 /MWh 150 116.56 100 52.18 50 22.05 1.72 1.72 0.10 0.10 0.10 0.10 0.08 0.08 0.08 0 11 11
Case Study Methodology Results Policy options EcoNUK) )Market interaction Dispatching Dispatching ( (EcoNUK Outputs Inputs POLES: Variable O&M costs Fuel costs CO2 tax Capacities installed Max Capacity Factors 10 Mt CO2 constraint ( tech) Power volume generated by technology Plant optimal dispatching ~ Capacity Factors Shadow price CO2 emissions Number of NPP cycles Deepness of NPP cycles Physical constraints (MinLoad) Ramping constraints Half- hour elec demand Half-hour inflows (wind/ solar/hydro) = Gap Optimisation Load Following value wrt Base Load Nuclear Fatigue Assessment Nuclear LCOE System Cost 12 12
Case Study Methodology Results Policy options EcoNUK Model description Power plants dispatching model: LP. Partial equilibrium dynamics. Demand.fx. MOC Eq Objective function = Short-run System costs minimisation: 8760 12 ??? ,??? ??????? +???????? + ?????2 ????? ???? = ?? ? + ?????? =1 ??? =1 Eq Hourly power market equilibrium Supply = Demand: 12 ??? ,??? + ? + ???? = (? + ? )/(1 ?????) + ??? ??? =1 Eq Availability constraints: ??? ,??? ?? ,??? ????? ???? Load Following Eq Ramping constraints: ????????<??? +1,??? ?????? 1 ???? < 1 + ???? ??? ,??? Eq Minimum load condition: ??? ,??? ??????? ,??? ?? ,??? ????? ???? Eq Storage dynamics: ?? +1= ?? + ??? ???? ?_??? /???? 13 13
Load Load following following assessment assessment Definitions Base-load continuous operation at steady full rated thermal power and full rated electrical output. Reduction in power output is induced by the plant operator s needs (for refuelling + periodic maintenance (planned); urgent maintenance to correct plant equipment issues (unplanned); or unexpected design + safety constraints). Steady state derated baseload operation ~ operating periodically continously at less than 100% full power. Load-following ~ flexible operation: the electrical output can be adjusted (automatically or manually) to meet the technical requirements and/or commercial agreements in interfacing with the grid in order to control the frequency and power flows of the electrical system. 4x1300 MW Cattenom NPP, operation by reactor, juin 2015 1400 1200 1000 800 600 400 200 0 1 3 5 7 9 11131517192123252729313335373941434547495153555759616365676971 -200 14 14 CATTENOM 1 CATTENOM 2 CATTENOM 3 CATTENOM 4
Case Study Methodology Results Policy options Load-following capability of a PWR Definitions Load-Followingis any change in the generation of electricity to match the expected electrical demand (>7%). Cyclingis measured by the transient from full power to local minimum load and back to full power. Load cycle (% power rate) 100-90-100 100-80-100 100-60-100 100-40-100 Number of cycles 100 000 100 000 15 000 12 000 Regulatory Requirements EUR: NPP must be capable of: Daily load-cycling 100-50-100 Pn; speed 3-5 %/min Pn; Maximum: 2 cycles/day = 5c/week = 200 cycle/ year. % Pn Full load 100% 90% 80% Light long cycle Light short cycle Local Min load Table. PWR Konvoi reactor design, number-deepness of cycles 60% 40% Ludwig et al., 2010. Tech Min load 25% Deep long cycle time The variations in output may be large or small, and may be frequent or infrequent. 15 15
Case Study Methodology Results Policy options Assessment of nuclear reactor fatigue Reactor Fatigue accounts here the number of cycles beyond the licence transient budget. Cycling accounting: ??????? = ??? ,??? ??? 1,???, if >0 ????????? = ??? ,??? ??? 1,???, if <0 Statistics of load-following operation of an average PWR reactor C0 C1 C2 C3 Reactor design Cycle deepness Annual budget of cycles, by fatigue type Weight of each cycle type in the total fatigue Example: RTE, 2016 nuclear operation Number of cycles Additional fatigue over one year by cycle type 100-90-100%100-80-100% 100-60-100% 100-40-100% 1 667 1 667 0.01% 0.03% 250 200 0.06% 0.08% 1 688 0.30% 18 0 0 0 0 0 Reduced reactor Load Following lifetime, days 2 16 16
Case Study Methodology Results Policy options Assessment of nuclear Load Assessment of nuclear Load- -Following Assumptions Following One third of reactors operate baseload: NPP ageing in case of previous cycling above design specifications begining + end of irradiation cycle. Two thirds operate flexibly. Equal distribution of load following needs among reactors Conservative rates: Ramping-down 2.5%/half-hour > Ramping-up 1%/half-hour. Figures: PWR French reactor flexibility: over a day (left), over the fuel cycle (right) 17 17 Cany et al., 2018 IAEA, 2018, S. Feutry,EdF.
Case Study Methodology Results Policy options Cycling statistics of ECONUK simulations based on Poles Climate Policy Scenario Calibrated max ramping rates under CO2 constraint (10 Mt CO2): - 7.5%/half-hour down - 5.5%/half-hour up Reduced cycling budget in 2030 = 52 days. Intensive cycling: light cycles (C0) Excessive cycling : middle deep cycles (C2). Statistics of load-following operation of an average PWR reactor Reactor design Cycle deepness Annual budget of cycles, by fatigue type Weight of each cycle type in the total fatigue Model results, 2030 Number of simulated cycles Additional fatigue over one year by cycle type Reduced reactor lifetime, days, by cycle type Reduced flexible operation lifetime, days Load Factor of Flexible NPP in 2030, % Load Factor of Inflexible NPP, % Load Factor All NPP, % C0 C1 C2 C3 10% 1 667 0.01% 20% 1 667 0.03% 40% 250 0.06% 60% 200 0.08% 1 555 1 106 502 14.0% 14 0 0 0 0 0 0.00 52 79% 87% 81.6% 51 18 18
Case Study Methodology Results Policy options NUC Load Following versus Base Load (= Steady State) dispatching Power Plant Dispatching day 1 / 2030, Scenario Load Following Nuclear Load Following substitutes Gas and avoids some RES curtailment. 100 000 80 000 60 000 MW 40 000 20 000 Technology GWh Nuclear Hydro River Hydro Lake CCGT NGGT Biomass Wind On Wind Off Solar Other RES Storage_out Coal Oil Load Following 1 211 Base Load 1 175 LF - BL 0 1 3 5 7 9 11 13 15 17 19 21 23 25 27 29 31 33 35 37 39 41 43 45 47 37 3 4 -41 -0 -21 12 0 5 -2 -1 - - Nuc Inflex Nuc Flex Pvs WinOn WinOf Hydro Coal oilst chpgas Bio Storage GsGT GsCC 42 32 2 39 28 43 0.3 163 212 79 74 40 Power Plant Dispatching day 1 / 2030, Scenario BaseLoad - 100 000 142 223 79 79 38 33 - - 80 000 60 000 MW 40 000 34 20 000 - - 0 1 3 5 7 9 11 13 15 17 19 21 23 25 27 29 31 33 35 37 39 41 43 45 47 19 19 Nuc Inflex Nuc Flex Pvs WinOn WinOf Hydro Coal oilst chpgas Bio Storage GsGT GsCC
Case Study Methodology Results Policy options NUC Load Following versus Steady State opportunity cost = System cost One day effects representation Half-hourly System cost over one day (01/01/2030) Titre de l'axe 2 500 000 System cost is triggered down by high nuclear output. 2 300 000 2 100 000 1 900 000 Load Following 1 700 000 Base Load 1 500 000 1 300 000 1 100 000 1 3 5 7 9 11 13 15 17 19 21 23 25 27 29 31 33 35 37 39 41 43 45 47 half-hour Nuclear Power Fleet operation over one day (01/01/2030) Nuclear Load Following allows operator to supply higher output than in the scenario Baseload. MW 60 000 55 000 NPP Load Following 50 000 45 000 NPP Base Load 40 000 35 000 1 3 5 7 9 11 13 15 17 19 21 23 25 27 29 31 33 35 37 39 41 43 45 47 20 20 half-hour
Case Study Methodology Results Policy options NUC Load Following versus Steady State opportunity cost = System cost Aggregated effects over the year Base Load Load Following LF - BL 16 372 15 488 10.14 4 456 - 27.88 Total System Cost, M CO2 Emissions, Mt RES Curtailment, GWh Oil-fired Plant Output, GWh Gas-fired Plant Output, GWh -884 -5 -8 278 -0.32 -57 15 12 733 0.32 84.96 1. Base Load nuclear operation is impossible to run under the carbon emission constraints. The system needs additional flexibility. Unless nuclear becomes flexible, more gas-fired units need to be operational. The carbon budget is exceeded by 5 Mt CO2. 2. 3. 4. 21 21
Case Study Methodology Results Policy options Renewable integration: reduced overall curtailment Nuclear Load Following helps integrating renewables over the year (+ 8 TWh; +4%). RES Curtailment TOTAL Base Load 6.44% 6.31% 9.7% 2.3% Load Following 2.25% 2.05% 3.8% 0.7% Volume, GWh 12 733 4 456 % Wind Volume, GWh 7 314 2 379 % PV Volume, GWh 5 045 1 974 % Hydro River Volume, GWh 384 107 % However, ponctually, flexibility of NPP could favor curtailment (100 GWh) due to inertia while cycling. Curtailment and NPP cycling MW Figure: the system selects higher nuclear supply in Load Following than in Base Load, admitting punctually some curtailment (higher than in Base Load). 60 000 50 000 40 000 NPP Load Following 30 000 NPP Base Load 20 000 Curtailment LF 10 000 0 1 3 5 7 9 11 13 15 17 19 21 23 25 27 29 31 33 35 37 39 41 43 45 47 49 51 53 55 half-hour 22
Case Study Methodology Results Policy options Capacity Capacity Factor and Fuel cycle Factor and Fuel cycle cost cost estimates estimates EcoNUK simulations Accurately anticipating the Capacity Factor is key to optimally manage the fuel and thus to minimise the fuel cycle cost. Capacity Factor Flexible NPP Inflexible NPP All Fleet Load Following Base Load 79% 87% 81.6% 80% 87% 82.3% EcoNUK tests show that aggregated Capacity Factors hinder large disparities among reactors used for Load Following and those used for Base Load, e.g. from 79% (in average) to 87%. CLASS simulations: Fuel Cost Variation to Capacity Factor, % 0% 100% 76% 75% 50% -5% -10% CLASS-Eco model proves useful to compute the sensitivity of the Fuel Cycle cost to the Capacity Factor. -15% -20% -25% -30% -35% -40% Capacity Factor, % 23
Case Study Methodology Results Policy options Next step: Iterations ClassEco Poles EcoNUK Objective: estimating nuclear Fuel cost function of Capacity Factor / Upgrading/ Discounting ????? ? ???? ??? 1 + ??? ??????~??? 1 + ??? ?????? ? ???? ??? 1 + ??? ???????~??? 1 + ??? 1 ? ????????????= + 1 ? ????? ? ???? ?? 1+??? ??????~?? 1+??? 1 Recycling Recycling = an option to = an option to reduce reduce VOM VOM cost cost ? ? 1 24 24
Cycling Methodology Results Policy options Regulatory Regulatory insights insights How could nuclear keep stable its position into the MOC? Flexible nuclear power plants operating load-following will bear additional costs with the retrofit and design conversion, O&M costs due to the wear of components, some fuel costs, staff costs and intensified safety measures (IAEA, 2018). Market design: conversion of fatigue cost into VOM. Merit order curve in 2030 300 256.82 250 175.90 200 /MWh 150 116.56 RENT 100 52.18 50 22.05 1.72 1.72 0.10 0.10 0.10 0.10 0.08 0.08 0.08 0 26 25
Case Study Methodology Results Policy options How future power How future power markets nuclear nuclear technological technological constraints markets will will account account for constraints? ? for Future architecture of wholesale power markets: dynamic reserves: reducing timeline gate closure-delivery co-optimization of energy and reserves market pricing internalizing non-convexity expected revenue adequacy guarantee (Conejo & Sioshansi, 2018) accounting for technological constraints of must run power plants no incentive for RES to generate electricity under negative prices (EU, TFEU art. 107): variable renewables curtailment. 25 26
Cycling Methodology Results Policy options Final Final Remarks Remarks Safety and and Regulation Nuclear Nuclear Safety Regulation in France in France In case of excessive cycling beyond the licence: Upgrading/ Refurbishment + 20 years more Early Reactor Retirement Baseload operation for the remaining license period Who pays for the additional fatigue? Who takes into account the nuclear technological constraints? Who deals next with technical constraints? ASN (safety regulator) IRSN (safety expert) EdF (generation operator). 27
Thank Thank you you for for your your attention! attention! RODICA LOISEL, RODICA.LOISEL@UNIV-NANTES.FR LIONEL LEMIALE, LIONEL.LEMIALE@UNIV-NANTES.FR NICOLAS THIOLLI RE, NICOLAS.THIOLLIERE@SUBATECH.IN2P3.FR 28
Context: Context: future futurenuclear cost estimates nuclear cost estimates Nuclear O&M Fuel management: complex relationship Macroeconomics: Investment decision, target policies Nuc Capacity Microeconomics: Interaction with other technologies Capacity Factor LF ??????? = ???? ?????+ ???????????+ ???????????? ????+ ???????????? ?~????????????+ ???+??????? 1 1+??? ???????????= ??????~?? 1+??? 1 ????? ? ???? ??? 1+??? ??????~??? 1+??? ?????? ? ???? ??? 1+??? ???????~??? 1+??? 1 ? ????????????= + 1 ? ?????????+ ???+??????? (1+??)? ??????~??? (1+??)? 1 ???????_??= 1 ????????????? (???)+ ??? (???)+??????? (1+??)? ???????~??? (1+??)? ? ???????_??_????????= ? Based on EC, DG ENER, 2013, Synthesis on the Economics of nuclear energy 2 29
