New Drug Capacity Calculator

New Drug Capacity Calculator
Instruction Manual

An Excel-based tool for estimating the resource required to deliver
newly approved chemotherapy drugs.
This tool was developed by the
NECN and GSK on behalf of the
Pharmaceutical Industry
Partnership Group (PIPG)


ZINC Code :
UK/ONC/0013/13d(1)
Date of Preparation:
February 2015


Click on the “Enter the model” button or use the tab at the bottom of the worksheet to go to the
“Introduction” sheet.
Sheet 1 - Cover
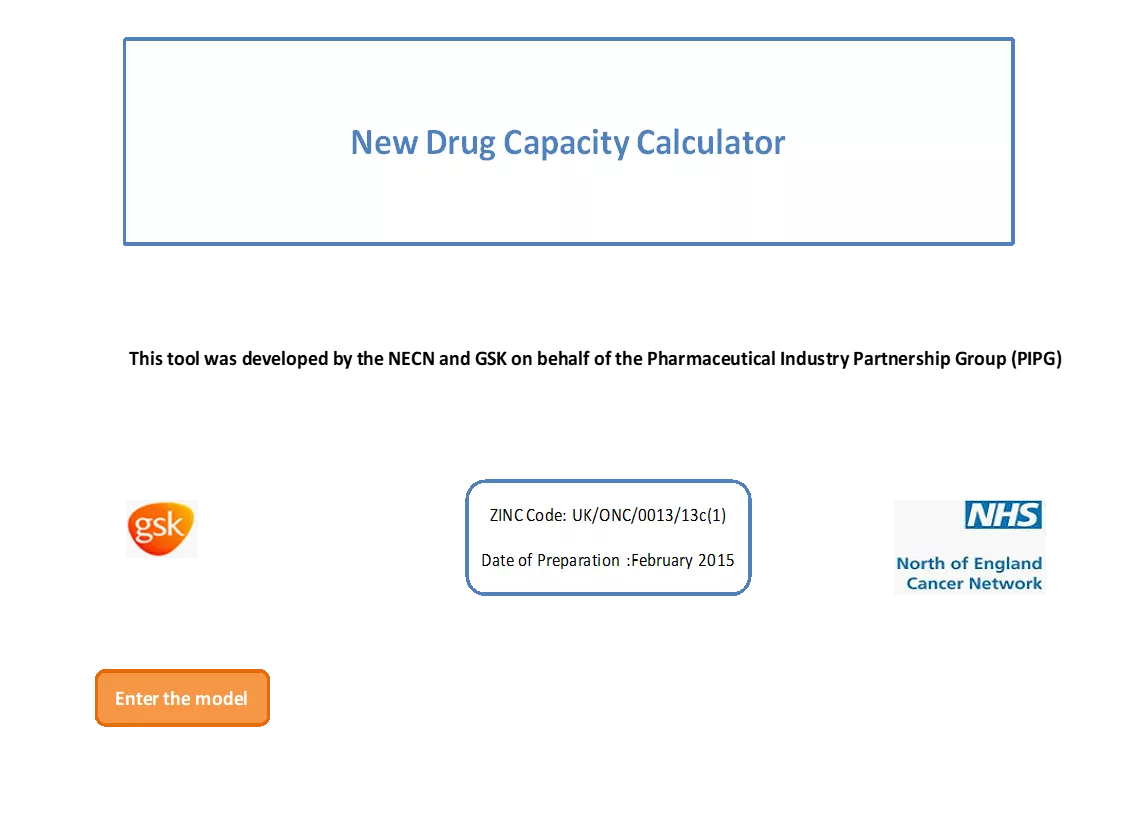
This worksheet has been designed to introduce the user to the New Drug Capacity Calculator and
allows the user to navigate directly to specific sheets in the tool using the blue buttons.
Sheet 2 - Introduction
No data input is required on this sheet.
Sheet 2 - Introduction
Functionality
Use arrows or
blue navigation
buttons to move
to next page.
Please read the
disclaimer.
Sheet 3 – Chemotherapy Pathway
This sheet has been designed to introduce the user to the Chemotherapy Pathway, as described in the
draft NHS Standard specification template for adult systemic anti-cancer therapy services (December
2012). Although the pathway may vary slightly according to local practice, the general flow of the
patient through this pathway should be similar in different parts of the country.
Click home button to
return to the Introduction
sheet.
Reference for document that
describes the pathway.
Describes the service area where capacity
calculation will be shown in the summary.
Sheet 3 – Chemotherapy Pathway
Functionality
Green boxes represent areas of the pathway
where capacity is being calculated.
Sheet 4 – Treatment Plan (1)
This sheet allows the user to put together a treatment plan for a cohort of patients. The delivery
time for delivering a new drug regimen to a cohort of patients is calculated on the basis of the input
data.
Sheet 4 – Treatment Plan (2)
Input the number of treatment cycles and the number of patients in this section of the treatment
plan worksheet.
Sheet 4 – Treatment Plan
Select “None” in “Drug
type” “Route” or “infusion
type” to blank out rows.
Use drop-down buttons to
input details of the
regimen. Input data
manually in the white
boxes that do not contain
drop-down lists.
Functionality
The headers for tables 1a
and 1b contain information
in the comments boxes.
Sum of infusion and
observation times for
specified number of
cycles for the whole
cohort of patients.
Follow the instructions in
Steps 1, 2 and 3.
Throughout the tool some cells contain additional information in the
comments box (as denoted by a red triangle). Hover your mouse over
the red triangle in the corner of the cell to view the information.
Sheet 5 – Pharmacy Capacity
This sheet allows the user to calculate the pharmacy capacity needed to deliver the newly approved
medications. It calculates the time needed for items that require aseptic preparation and those that are
pre-filled items. The output is expressed in Whole Time Equivalents (WTE) days for pharmacy staff and
the isolator time needed to deliver the regimen to a cohort of patients.
Sheet 5 – Pharmacy Capacity
Use the drop-down
buttons to input
data on the variable
time activities.
Functionality
Data on the number of
patients, cycles and
items is drawn from the
“Treatment plan” sheet.
Select hyperlink to
“Pharmacy References”
sheet to change or
review fixed times.
Select hyperlink to “local
Assumptions” sheet to whole
time equivalent (WTE) figure
which is set at a default figure of
5.4 hours.
Input data manually in the
white box for isolator
cleaning time multiplier.
Sheet 6 – Nurse Capacity
This sheet allows the user to calculate the nurse capacity needed to deliver the newly approved regimen. It
calculates the time needed for the nurses to deliver the specified regimen for a cohort of patients. The
output is expressed in WTE days of nurse staff resource needed for delivery of the regimen.
Input the total time
per patient for the
activities described in
steps 2, 3 and 5.
Cycle 1 data may be
entered separately
from that of
subsequent cycles.
Nurse activities that
require chair time and
those that do not, need
to be entered in
different sections of the
table.
Use the drop-down
buttons to input data.
Nurse resource that requires chair time and
total nurse resource is calculated.
Sheet 6 – Nurse Capacity
Functionality
Sheet 7 – Chair Capacity
This sheet shows the chair capacity needed to deliver the newly approved regimen for a cohort of
patients.
Sheet 7 – Chair Capacity
Shows the different drug types that need to
be delivered for the new regimen in the
chemotherapy unit.
Data is drawn from the “Treatment
plan” and “Nurse Capacity” sheets.
The default setting is that each chair is
bookable for 7.5 hours/day
Functionality
No data input is required on this sheet.
Sheet 8 – Pathway Results
This sheet collates the capacity information on resources needed to deliver the newly approved regimen.
It is designed to act as a snap-shot of the collated resources and may be used to provide an overview of
the overall capacity needed for delivery of a newly approved drug regimen. As it draws on the inputs
from previous sections, the previous worksheets have to be completed before the overview can be
generated.
Sheet 8 – Pathway Results
Grey boxes indicate which capacities have been calculated.
Functionality
The totals on the Pharmacy , Nurse and Chair Capacity worksheets are summarised here
.
Sheet 9 –Results Table
The results are tabulated on this worksheet.
No inputs are required.
This sheet shows the information on the local assumptions that are used in the Capacity
Calculator tool. The assumptions currently used are derived from the data that has been
provided by the Newcastle Cancer Centre.
Sheet 10 – Local Assumptions
To change the WTE, input the
number of hours/day manually
into the white box.
Time available for performing fixed time tasks.
For details of the actual times used in the fixed
time calculations, refer to the “Pharmacy
References” page.
Functionality
To change the number of hours
that the chemotherapy unit is
open, input the number of hours
manually into the white box.
This sheet gives details of the aseptic preparation fixed times used in the pharmacy capacity
calculations. The times that are currently in the tool are derived from the data that has been provided
by the Newcastle Cancer Centre. If local data needs to be used, the data in the white boxes can be
changed manually.
Sheet 11 – Pharmacy references
Sheet 12 – Activity Tariffs
This sheet shows the likely tariff costs for delivery of the new chemotherapy regimen.
Sheet 12 – Activity Tariffs
Functionality
Use hyperlink to
review national
tariff Information.
Select “Yes” in Step 1
if the new regimen is
comprised totally of
oral drugs.
Use this section of
the worksheet for
activities that are
not on the national
tariff list. Manually
input the tariff in
the white box.
For parenteral drugs
select “Yes” once in
this section.
Sheet 13 Tariff Information
Details of the HRG codes and tariff costs used in the calculation of the
activity tariffs are given on this sheet. The reference is also provided.
The ZINC code for the tool is UK/ONC/0013/13c(1)
This Excel-based tool, developed by NECN and GSK for the Pharmaceutical Industry Partnership Group, helps estimate resources needed to deliver newly approved chemotherapy drugs. It includes calculations for pharmacy and nurse resources, chair time, and activity tariffs. The tool serves as a planning aid and guides users to specific pages for detailed calculations and considerations. Disclaimer: The model outputs are dependent on user inputs and assumptions. GSK and NHS England do not guarantee suitability for any specific purpose. Access the tool for efficient resource planning in chemotherapy drug delivery.

Download Presentation

Please find below an Image/Link to download the presentation.
The content on the website is provided AS IS for your information and personal use only. It may not be sold, licensed, or shared on other websites without obtaining consent from the author.If you encounter any issues during the download, it is possible that the publisher has removed the file from their server.
You are allowed to download the files provided on this website for personal or commercial use, subject to the condition that they are used lawfully. All files are the property of their respective owners.
The content on the website is provided AS IS for your information and personal use only. It may not be sold, licensed, or shared on other websites without obtaining consent from the author.
E N D
Presentation Transcript
This tool was developed by the NECN and GSK on behalf of the Pharmaceutical Industry Partnership Group (PIPG) New Drug Capacity Calculator An Excel-based tool for estimating the resource required to deliver newly approved chemotherapy drugs. Instruction Manual ZINC Code : Date of Preparation: UK/ONC/0013/13d(1) February 2015
Sheet 1 - Cover New Drug Capacity Calculator This tool was developed by the NECN and GSK on behalf of the Pharmaceutical Industry Partnership Group (PIPG) ZINC Code: UK/ONC/0013/13c(1) Date of Preparation :February 2015 Enter the model Click on the Enter the model button or use the tab at the bottom of the worksheet to go to the Introduction sheet.
Sheet 2 - Introduction New Drug Capacity Calculator NEXT The New Drug Capacity Calculator is an Excel-based tool for estimating the resource required to deliver newly approved chemotherapy drugs. The pharmacy resource, nurse resource, chair time and activity tariff can be estimated using this tool. The New Drug Capacity Calculator may assist with planning but it is not intended as a resource scheduling tool. PREVIOUS Click on the blue buttons below to navigate to the specific page of the New Drug Capacity Calculator. Chemotherapy Pathway Pharmacy Capacity Treatment Plan Nurse Capacity Chair Capacity Activity Tariffs The draft NHS standard specification template for adult systemic anti-cancer therapy services (December 2012)1 specifies that the pathway of care for any chemotherapy patient will need to ensure that the provider services have capacity (in terms of oncology pharmacists and technical pharmacy staff and chairs) for checking prescriptions, reconstitution, and deliver of chemotherapy drugs. 1Draft NHS Standard specification template for adult systemic anti-cancer therapy services, December 2012 https://www.engage.england.nhs.uk/consultation/ssc-area-b/supporting_documents/b3lservicespec.pdf Accessed January 2015 Costs and savings figures used in the model are for illustrative purposes only and the user's attention is drawn to the fact that outputs from the model are subject to a) the assumptions described within the model and b) the data that the user selects or decides to input into the model. GSK and NHS England accept no liability for losses arising, directly or indirectly, from the use of the model or its output. GSK and NHS England make no representation or warranty as to the suitability of the output of the model for any particular purpose. This worksheet has been designed to introduce the user to the New Drug Capacity Calculator and allows the user to navigate directly to specific sheets in the tool using the blue buttons.
Sheet 2 - Introduction Functionality New Drug Capacity Calculator NEXT The New Drug Capacity Calculator is an Excel-based tool for estimating the resource required to deliver newly approved chemotherapy drugs. The pharmacy resource, nurse resource, chair time and activity tariff can be estimated using this tool. The New Drug Capacity Calculator may assist with planning but it is not intended as a resource scheduling tool. PREVIOUS Click on the blue buttons below to navigate to the specific page of the New Drug Capacity Calculator. Use arrows or blue navigation buttons to move to next page. Chemotherapy Pathway Pharmacy Capacity Treatment Plan Nurse Capacity Chair Capacity Activity Tariffs The draft NHS standard specification template for adult systemic anti-cancer therapy services (December 2012)1 specifies that the pathway of care for any chemotherapy patient will need to ensure that the provider services have capacity (in terms of oncology pharmacists and technical pharmacy staff and chairs) for checking prescriptions, reconstitution, and deliver of chemotherapy drugs. 1Draft NHS Standard specification template for adult systemic anti-cancer therapy services, December 2012 https://www.engage.england.nhs.uk/consultation/ssc-area-b/supporting_documents/b3lservicespec.pdf Accessed January 2015 Costs and savings figures used in the model are for illustrative purposes only and the user's attention is drawn to the fact that outputs from the model are subject to a) the assumptions described within the model and b) the data that the user selects or decides to input into the model. GSK and NHS England accept no liability for losses arising, directly or indirectly, from the use of the model or its output. GSK and NHS England make no representation or warranty as to the suitability of the output of the model for any particular purpose. Please read the disclaimer. No data input is required on this sheet.
Sheet 3 Chemotherapy Pathway CHEMOTHERAPY PATHWAY* For information only, no data input required on this sheet The New Drug Capacity Calculator estimates pharmacy capacity (staff and isolator time), oncology nurse capacity and oncology chair time associated with treating a cohort of patients with a new regimen of cancer drugs Chemotherapy bookedfor patient Check blood tests Additional monitoring Nurse to administer chemotherapy Prescription verified by oncology pharmacist Chemotherapy prescribed for patient Patient arrives for chemotherapy Chemotherapy organised Clinical review by nurse Discharge Prepare patients for chemotherapy Prepare chemotherapy in advance or on day Initiate Synchronise bookingwith radiotherapy Schedule patients for chemotherapy reconstitution& handling of chemotherapy Calculate oncology nurse capacity Calculate oncology chair time Calculate pharmacy capacity (isolator time and WTE) WTE = Whole Time Equivalent Key Areas of the pathway where capacity will be calculated Areas of the pathway that will NOT be included in the capacity calculations * Sample pathway as described in the draft NHS standard specification template for adult systemic anti-cancer therapy services, December 2012. https://www.engage.england.nhs.uk/consultation/ssc-area-b/supporting_documents/b3lservicespec.pdf Accessed January 2015 NEXT For current service specification refer to NHS England Chemotherapy CRG webpage. http://www.england.nhs.uk/commissioning/spec-services/npc-crg/group-b/b15/ PREVIOUS Acessed January 2015 This sheet has been designed to introduce the user to the Chemotherapy Pathway, as described in the draft NHS Standard specification template for adult systemic anti-cancer therapy services (December 2012). Although the pathway may vary slightly according to local practice, the general flow of the patient through this pathway should be similar in different parts of the country.
Sheet 3 Chemotherapy Pathway Functionality Green boxes represent areas of the pathway where capacity is being calculated. CHEMOTHERAPY PATHWAY* For information only, no data input required on this sheet The New Drug Capacity Calculator estimates pharmacy capacity (staff and isolator time), oncology nurse capacity and oncology chair time associated with treating a cohort of patients with a new regimen of cancer drugs Chemotherapy bookedfor patient Check blood tests Additional monitoring Nurse to administer chemotherapy Prescription verified by oncology pharmacist Chemotherapy prescribed for patient Patient arrives for chemotherapy Chemotherapy organised Clinical review by nurse Discharge Prepare patients for chemotherapy Prepare chemotherapy in advance or on day Initiate Synchronise bookingwith radiotherapy Schedule patients for chemotherapy reconstitution& handling of chemotherapy Calculate oncology nurse capacity Calculate oncology chair time Calculate pharmacy capacity (isolator time and WTE) WTE = Whole Time Equivalent Key Areas of the pathway where capacity will be calculated Areas of the pathway that will NOT be included in the capacity calculations * Sample pathway as described in the draft NHS standard specification template for adult systemic anti-cancer therapy services, December 2012. https://www.engage.england.nhs.uk/consultation/ssc-area-b/supporting_documents/b3lservicespec.pdf Accessed January 2015 NEXT For current service specification refer to NHS England Chemotherapy CRG webpage. http://www.england.nhs.uk/commissioning/spec-services/npc-crg/group-b/b15/ PREVIOUS Acessed January 2015 Click home button to return to the Introduction sheet. Reference for document that describes the pathway. Describes the service area where capacity calculation will be shown in the summary.
Sheet 4 Treatment Plan (1) CALCULATE CHEMOTHERAPY DELIVERY TIME FOR COHORT OF PATIENTS FOR ONE YEAR Detailed treatment plan (per patient) NEXT PREVIOUS Step 1: Select, drug type, route, infusion type and times using the drop-down buttons If Cycle 1 is different from subsequent cycles select "Yes" and complete Tables 1a and 1b. If Cycle 1 is the same as subsequent cycles select "No" and complete Table 1b only. Select "No" to set the totals in Table 1a to zero. Yes Is Cycle 1 different? Drug type Route Infusion type Infusion time (mins) Observation time (mins) Administrations per cycle Manually input data into the white boxes that do not have drop-down buttons. Table 1a Drug 1 1 Oral Oral Not Applicable 15 0 2 IV IV Infusion Ready made infusion bag 60 60 Drug 2 First Cycle 1 IV IV Bolus Infusion bag 60 0 Drug 3 1 IV Sub-cut Syringe 10 0 Drug 4 1 MAB IV Infusion Infusion bag 60 180 Drug 5 Select "None'"for drug type, route and infusion type to blank out rows when less than 6 drugs are used in the regimen. 1 None None None 0 0 Drug 6 250 315 Time for first cycle Table 1b Oral Oral Not Applicable 0 0 Drug 1 1 Subsequent Cycles IV IV Infusion Ready made infusion bag 60 60 1 Drug 2 Infusion times are ignored for oral drugs Infusion times are ignored for oral drugs. Observation times can be included by selecting "Not Applicable" in the "Infusion type" column and selecting an observation time. IV IV Infusion Infusion bag 60 0 1 Drug 3 All or IV Sub-cut Syringe 10 0 1 Drug 4 IV IV Infusion Infusion bag 60 180 1 Drug 5 None None None 0 0 1 Drug 6 Time per cycle for all/ subsequent cycles 190 240 Yes Sum the values in table 1b? Select "No" to set the totals in Table 1b to zero. This sheet allows the user to put together a treatment plan for a cohort of patients. The delivery time for delivering a new drug regimen to a cohort of patients is calculated on the basis of the input data.
Sheet 4 Treatment Plan (2) Step 2: Individualise treatment plan for one patient Table 2 Total time per patient (hours) For clinical trials enter the average number of cycles in the trial. Enter planned number of cycles 10 74 Step 3. Chemotherapy delivery time for cohort Table 3 Total time for cohort 1,109 hours Enter number of patients to be treated per year NEXT 15 148 days PREVIOUS Input the number of treatment cycles and the number of patients in this section of the treatment plan worksheet.
Sheet 4 Treatment Plan Functionality Follow the instructions in Steps 1, 2 and 3. CALCULATE CHEMOTHERAPY DELIVERY TIME FOR COHORT OF PATIENTS FOR ONE YEAR Detailed treatment plan (per patient) NEXT PREVIOUS Step 1: Select, drug type, route, infusion type and times using the drop-down buttons If Cycle 1 is different from subsequent cycles select "Yes" and complete Tables 1a and 1b. If Cycle 1 is the same as subsequent cycles select "No" and complete Table 1b only. Select "No" to set the totals in Table 1a to zero. Yes The headers for tables 1a and 1b contain information in the comments boxes. Is Cycle 1 different? Drug type Route Infusion type Infusion time (mins) Observation time (mins) Administrations per cycle Manually input data into the white boxes that do not have drop-down buttons. Table 1a Drug 1 1 Oral Oral Not Applicable 15 0 2 IV Ready made infusion bag IV Infusion 60 60 Drug 2 First Cycle 1 IV IV Bolus Infusion bag 60 0 Drug 3 1 IV Sub-cut Syringe 10 0 Drug 4 Use drop-down buttons to input details of the regimen. Input data manually in the white boxes that do not contain drop-down lists. 1 MAB IV Infusion Infusion bag 60 180 Drug 5 Select "None'"for drug type, route and infusion type to blank out rows when less than 6 drugs are used in the regimen. 1 None None None 0 0 Drug 6 250 315 Time for first cycle Table 1b Oral Oral Not Applicable 0 0 Drug 1 1 Subsequent Cycles IV IV Infusion Ready made infusion bag 60 60 1 Drug 2 Infusion times are ignored for oral drugs Infusion times are ignored for oral drugs. Observation times can be included by selecting "Not Applicable" in the "Infusion type" column and selecting an observation time. IV IV Infusion Infusion bag 60 0 1 Drug 3 All or IV Sub-cut Syringe 10 0 1 Drug 4 IV IV Infusion Infusion bag 60 180 1 Drug 5 None None None 0 0 1 Drug 6 Time per cycle for all/ subsequent cycles 190 240 Yes Sum the values in table 1b? Select "No" to set the totals in Table 1b to zero. Select None in Drug type Route or infusion type to blank out rows. Step 2: Individualise treatment plan for one patient Table 2 Total time per patient (hours) For clinical trials enter the average number of cycles in the trial. Enter planned number of cycles 10 74 Step 3. Chemotherapy delivery time for cohort Sum of infusion and observation times for specified number of cycles for the whole cohort of patients. Table 3 Total time for cohort 1,109 hours Enter number of patients to be treated per year NEXT 15 148 days PREVIOUS Throughout the tool some cells contain additional information in the comments box (as denoted by a red triangle). Hover your mouse over the red triangle in the corner of the cell to view the information.
Sheet 5 Pharmacy Capacity CALCULATE PHARMACY CAPACITY NEXT Time in the white box for isolator cleaning time can be changed by overtyping, times in the "Variable time" column can be changed using the drop-down buttons. Fixed times and Whole Time Equivalent (WTE) times can be modified by clicking on the hyperlinks below. No other figures should be changed on this sheet. PREVIOUS Type of Item/activity Number of cycles Quantity for cohort Fixed time/ item (min) Variable time /item (min) Total time (hours) Staff time (WTE days) Isolator time (days) PRESCRIPTION VERIFICATION/REVIEW Step 1 - Select times for prescription verification/review Cycle 1 prescription verification/review Subsequent cycles prescription verification/review 10 1 15 N/A 2.5 0.5 N/A 5 9 135 N/A 11.3 2.1 N/A TOTAL TIME FOR PRESCRIPTION VERIFICATION/ REVIEW FOR THE COHORT 13.8 2.5 ADDITIONAL CHECKS Step 2 - Select time for additional checks Check blood tests 10 150 25.0 4.6 N/A 10 N/A Other checks 10 150 12.5 2.3 N/A 5 N/A TOTAL TIME FOR ADDITIONAL CHECKS FOR COHORT 37.5 6.9 MANUFACTURING - CYCLE 1 Step 3 - Select time for manufacturing each item - Cycle 1 Isolator time in days is calculated on the basis of 7.5 hours. Staff time in days is based on Whole Time Equivalent (WTE). Infusion bag 1 30 34 47.0 8.7 6.3 60 Syringe 1 15 24 13.5 2.5 1.8 30 Ready made syringe 1 0 0.0 0.0 0.0 0 15 Ready made infusion bag 1 30 7.5 1.4 1.0 0 15 10 Oral 1 15 2.5 0.5 N/A 0 TOTAL MANUFACTURING TIME FOR CYCLE 1 70.5 13.1 9.1 MANUFACTURING - ALL/SUBSEQUENT CYCLES Step 4 - Select time for manufacturing each item - all/subsequent cycles) Infusion bag 9 270 34 288.0 53.3 38.4 30 Syringe 9 135 24 121.5 22.5 16.2 30 Click here to change the number of hours that constitute WTE. Ready made syringe 9 0 0.0 0.0 0.0 0 15 Ready made infusion bag 9 135 33.8 6.3 4.5 0 15 10 Oral 9 135 22.5 4.2 N/A 0 TOTAL MANUFACTURING TIME FOR ALL/SUBSEQUENT CYCLES 465.8 86.3 59.1 ISOLATOR CLEANING Step 5 - Review time assigned for cleaning isolator(s)* Isolator cleaning time 1 52 0.9 N/A N/A N/A N/A TOTAL PHARMACY RESOURCE REQUIREMENTS FOR THE COHORT 109 68 588 *Isolator cleaning time is applied to infusion bags and syringes only. N/A = Not Applicable NEXT Click here to change fixed times. WTE = Whole Time Equivalent PREVIOUS Click here to change the number of hours that constitiute WTE This sheet allows the user to calculate the pharmacy capacity needed to deliver the newly approved medications. It calculates the time needed for items that require aseptic preparation and those that are pre-filled items. The output is expressed in Whole Time Equivalents (WTE) days for pharmacy staff and the isolator time needed to deliver the regimen to a cohort of patients.
Sheet 5 Pharmacy Capacity Functionality CALCULATE PHARMACY CAPACITY NEXT Time in the white box for isolator cleaning time can be changed by overtyping, times in the "Variable time" column can be changed using the drop-down buttons. Fixed times and Whole Time Equivalent (WTE) times can be modified by clicking on the hyperlinks below. No other figures should be changed on this sheet. PREVIOUS Type of Item/activity Number of cycles Quantity for cohort Fixed time/ item (min) Variable time /item (min) Total time (hours) Staff time (WTE days) Isolator time (days) PRESCRIPTION VERIFICATION/REVIEW Step 1 - Select times for prescription verification/review Use the drop-down buttons to input data on the variable time activities. Cycle 1 prescription verification/review Subsequent cycles prescription verification/review 10 1 15 N/A 2.5 0.5 N/A 5 9 135 N/A 11.3 2.1 N/A TOTAL TIME FOR PRESCRIPTION VERIFICATION/ REVIEW FOR THE COHORT 13.8 2.5 ADDITIONAL CHECKS Step 2 - Select time for additional checks Check blood tests 10 150 25.0 4.6 N/A 10 N/A Other checks 10 150 12.5 2.3 N/A 5 N/A TOTAL TIME FOR ADDITIONAL CHECKS FOR COHORT 37.5 6.9 MANUFACTURING - CYCLE 1 Step 3 - Select time for manufacturing each item - Cycle 1 Isolator time in days is calculated on the basis of 7.5 hours. Staff time in days is based on Whole Time Equivalent (WTE). Infusion bag 1 30 34 47.0 8.7 6.3 60 Syringe 1 15 24 13.5 2.5 1.8 30 Ready made syringe 1 0 0.0 0.0 0.0 0 15 Data on the number of patients, cycles and items is drawn from the Treatment plan sheet. Ready made infusion bag 1 30 7.5 1.4 1.0 0 15 10 Oral 1 15 2.5 0.5 N/A 0 TOTAL MANUFACTURING TIME FOR CYCLE 1 70.5 13.1 9.1 MANUFACTURING - ALL/SUBSEQUENT CYCLES Step 4 - Select time for manufacturing each item - all/subsequent cycles) Infusion bag 9 270 34 288.0 53.3 38.4 30 Syringe 9 135 24 121.5 22.5 16.2 30 Click here to change the number of hours that constitute WTE. Ready made syringe 9 0 0.0 0.0 0.0 0 15 Ready made infusion bag 9 135 33.8 6.3 4.5 0 15 10 Oral 9 135 22.5 4.2 N/A 0 TOTAL MANUFACTURING TIME FOR ALL/SUBSEQUENT CYCLES 465.8 86.3 59.1 ISOLATOR CLEANING Step 5 - Review time assigned for cleaning isolator(s)* Isolator cleaning time 1 52 0.9 N/A N/A N/A N/A TOTAL PHARMACY RESOURCE REQUIREMENTS FOR THE COHORT 109 68 588 *Isolator cleaning time is applied to infusion bags and syringes only. N/A = Not Applicable NEXT Click here to change fixed times. WTE = Whole Time Equivalent PREVIOUS Click here to change the number of hours that constitiute WTE Select hyperlink to local Assumptions sheet to whole time equivalent (WTE) figure which is set at a default figure of 5.4 hours. Select hyperlink to Pharmacy References sheet to change or review fixed times. Input data manually in the white box for isolator cleaning time multiplier.
Sheet 6 Nurse Capacity CALCULATE NURSE CAPACITY Times in the "Time/cycle/patient" column can be changed using the drop-down buttons. Whole Time Equivalent (WTE) times can be modified by clicking on the hyperlink below. No other figures should be changed on this sheet. NEXT PREVIOUS Type of Item/activity Quantity/patient Time /cycle/patient for regimen (min) Total time for cohort (hours) Staff resource (WTE days) CLINICAL REVIEW (NOT INCLUDED IN CHAIR TIME) Step 1 - Select times for the following clinical review activities Check blood tests Administrative tasks Pre-chemo assessment Other clinical assessments Total times for clinical review N/A N/A N/A N/A 50.0 50.0 37.5 12.5 150.0 9.3 9.3 6.9 2.3 27.8 20 20 15 5 ADDITIONAL CHECKS/PREPARATION (NOT INCLUDED IN CHAIR TIME) Step 2 - Select combined time for activities The assumption in Steps 1 & 4 is that the activites will take similar lengths of time for cycle 1 and subsequent cycles. In Steps 2, 3 & 5 different times may be selected for cycle 1 and subsequent cycles. Cycle 1 Subsequent cycles Total times for additional checks/preparations that do not use chair time N/A N/A 5.0 45.0 50.0 0.9 8.3 9.3 20 20 PATIENT & EQUIPMENT CHECKS/PREPARATION (INCLUDED IN CHAIR TIME) Step 3 - Select combined time for this type of activity Cycle 1 Subsequent cycles Total times for patient & equipment checks/preparation that use chair time N/A N/A 15.0 135.0 150.0 2.8 25.0 27.8 60 60 CHEMOTHERAPY DRUG ADMINISTRATION (INCLUDED IN CHAIR TIME) Step 4 - Select times for drug administration Oral Sub-cut Intramuscular IV bolus 1 1 0 0 3 0 12.5 12.5 0.0 0.0 37.5 0.0 62.5 2.3 2.3 0.0 0.0 6.9 0.0 11.6 5 5 5 5 5 IV infusion Intrathecal Total times for chemotherapy drug administration Click here to change the number of hours that constitute WTE. 5 TIME SPENT MONITORING PATIENT (INCLUDED IN CHAIR TIME) Step 5 - Select time the nurse spends with patient Cycle 1 Subsequent cycles Total time spent monitoring patients N/A N/A 5.0 45.0 50.0 0.9 8.3 9.3 20 20 TOTALS FOR ACTIVITIES THAT REQUIRE CHAIR TIME TOTAL NURSE RESOURCE REQUIREMENT FOR THE COHORT 263 463 49 86 NEXT PREVIOUS This sheet allows the user to calculate the nurse capacity needed to deliver the newly approved regimen. It calculates the time needed for the nurses to deliver the specified regimen for a cohort of patients. The output is expressed in WTE days of nurse staff resource needed for delivery of the regimen.
Sheet 6 Nurse Capacity Functionality CALCULATE NURSE CAPACITY Times in the "Time/cycle/patient" column can be changed using the drop-down buttons. Whole Time Equivalent (WTE) times can be modified by clicking on the hyperlink below. No other figures should be changed on this sheet. NEXT Use the drop-down buttons to input data. PREVIOUS Type of Item/activity Quantity/patient Time /cycle/patient for regimen (min) Total time for cohort (hours) Staff resource (WTE days) CLINICAL REVIEW (NOT INCLUDED IN CHAIR TIME) Step 1 - Select times for the following clinical review activities Check blood tests Administrative tasks Pre-chemo assessment Other clinical assessments Total times for clinical review N/A N/A N/A N/A 50.0 50.0 37.5 12.5 150.0 9.3 9.3 6.9 2.3 27.8 20 20 15 5 Nurse activities that require chair time and those that do not, need to be entered in different sections of the table. ADDITIONAL CHECKS/PREPARATION (NOT INCLUDED IN CHAIR TIME) Step 2 - Select combined time for activities The assumption in Steps 1 & 4 is that the activites will take similar lengths of time for cycle 1 and subsequent cycles. In Steps 2, 3 & 5 different times may be selected for cycle 1 and subsequent cycles. Cycle 1 Subsequent cycles Total times for additional checks/preparations that do not use chair time N/A N/A 5.0 45.0 50.0 0.9 8.3 9.3 20 20 PATIENT & EQUIPMENT CHECKS/PREPARATION (INCLUDED IN CHAIR TIME) Step 3 - Select combined time for this type of activity Cycle 1 Subsequent cycles Total times for patient & equipment checks/preparation that use chair time N/A N/A 15.0 135.0 150.0 2.8 25.0 27.8 60 60 CHEMOTHERAPY DRUG ADMINISTRATION (INCLUDED IN CHAIR TIME) Step 4 - Select times for drug administration Oral Sub-cut Intramuscular IV bolus 1 1 0 0 3 0 12.5 12.5 0.0 0.0 37.5 0.0 62.5 2.3 2.3 0.0 0.0 6.9 0.0 11.6 5 5 5 5 5 Input the total time per patient for the activities described in steps 2, 3 and 5. Cycle 1 data may be entered separately from that of subsequent cycles. IV infusion Intrathecal Total times for chemotherapy drug administration Click here to change the number of hours that constitute WTE. 5 TIME SPENT MONITORING PATIENT (INCLUDED IN CHAIR TIME) Step 5 - Select time the nurse spends with patient Cycle 1 Subsequent cycles Total time spent monitoring patients N/A N/A 5.0 45.0 50.0 0.9 8.3 9.3 20 20 TOTALS FOR ACTIVITIES THAT REQUIRE CHAIR TIME TOTAL NURSE RESOURCE REQUIREMENT FOR THE COHORT 263 463 49 86 NEXT PREVIOUS Nurse resource that requires chair time and total nurse resource is calculated.
Sheet 7 Chair Capacity ESTIMATE OF CHAIR CAPACITY NEXT Summary of treatment plan Drug Type Oral Sub-cut Intramuscular IV bolus IV infusion Intrathecal Items to administer 1 1 0 0 3 0 PREVIOUS Number of patients Total time from treatment plan (hours) Nurse led activities (hours)* 15 1,109 213 Total chair occupation time in chemotherapy delivery unit TOTAL CHAIR TIME REQUIRED FOR THE COHORT (days) 176 * The nurse monitoring time is omitted from the calculation of chair time. It is covered within the observation time recorded on the 'Treatment Plan' worksheet and hence is already captured in the "Total time from treatment plan" figure shown on this worksheet. This sheet shows the chair capacity needed to deliver the newly approved regimen for a cohort of patients.
Sheet 7 Chair Capacity Functionality ESTIMATE OF CHAIR CAPACITY NEXT Summary of treatment plan Drug Type Oral Sub-cut Intramuscular IV bolus IV infusion Intrathecal Items to administer 1 1 0 0 3 0 PREVIOUS Shows the different drug types that need to be delivered for the new regimen in the chemotherapy unit. Number of patients Total time from treatment plan (hours) Nurse led activities (hours)* 15 Data is drawn from the Treatment plan and Nurse Capacity sheets. 1,109 213 Total chair occupation time in chemotherapy delivery unit The default setting is that each chair is bookable for 7.5 hours/day TOTAL CHAIR TIME REQUIRED FOR THE COHORT (days) 176 * The nurse monitoring time is omitted from the calculation of chair time. It is covered within the observation time recorded on the 'Treatment Plan' worksheet and hence is already captured in the "Total time from treatment plan" figure shown on this worksheet. No data input is required on this sheet.
Sheet 8 Pathway Results CHEMOTHERAPY PATHWAY - CAPACITY REQUIRED* This page presents the results of this capacity estimate (pharmacy capacity (WTE and isolator time), oncology nurse capacity and oncology chair time associated with delivery of the regimen you have detailed for the cohort of interest). Chemotherapy bookedfor Check blood tests Additional monitoring Chemotherapy prescribed for patient Prescription verified by oncology Patient arrives for chemotherapy Nurse to administer chemotherapy Chemotherapy organised Clinical review by nurse Discharge Prepare patients for chemotherapy Prepare chemotherapy in advance or on day Initiate Synchronise bookingwith radiotherapy Schedule patients for chemotherapy reconstitution& handling of chemotherapy Calculate pharmacy capacity (Isolator time and WTE) Calculate oncology nurse capacity Calculate oncology chair time 109 86 176 Staff Resource (WTE days) Isolator time (days) Staff Resource (WTE days) Chair time (days) 68 WTE = Whole Time Equivalent Key Click here for ResultsTable. Areas of the pathway where capacity will be calculated Areas of the pathway that will NOT be included in the capacity calculations * Sample pathway as described in the draft NHS standard specification template for adult systemic anti-cancer therapy services, December 2012. https://www.engage.england.nhs.uk/consultation/ssc-area-b/supporting_documents/b3lservicespec.pdf Accessed January 2015 NEXT For current service specification refer to NHS England Chemotherapy CRG webpage. http://www.england.nhs.uk/commissioning/spec-services/npc-crg/group-b/b15/ PREVIOUS Acessed January 2015 This sheet collates the capacity information on resources needed to deliver the newly approved regimen. It is designed to act as a snap-shot of the collated resources and may be used to provide an overview of the overall capacity needed for delivery of a newly approved drug regimen. As it draws on the inputs from previous sections, the previous worksheets have to be completed before the overview can be generated.
Sheet 8 Pathway Results Functionality CHEMOTHERAPY PATHWAY - CAPACITY REQUIRED* This page presents the results of this capacity estimate (pharmacy capacity (WTE and isolator time), oncology nurse capacity and oncology chair time associated with delivery of the regimen you have detailed for the cohort of interest). Chemotherapy bookedfor Check blood tests Additional monitoring Chemotherapy prescribed for patient Prescription verified by oncology Patient arrives for chemotherapy Nurse to administer chemotherapy Chemotherapy organised Clinical review by nurse Discharge Prepare patients for chemotherapy Prepare chemotherapy in advance or on day Initiate Synchronise bookingwith radiotherapy Schedule patients for chemotherapy reconstitution& handling of chemotherapy Calculate pharmacy capacity (Isolator time and WTE) Calculate oncology nurse capacity Calculate oncology chair time 109 86 176 Staff Resource (WTE days) Isolator time (days) Staff Resource (WTE days) Chair time (days) 68 WTE = Whole Time Equivalent Key Click here for ResultsTable. Areas of the pathway where capacity will be calculated Areas of the pathway that will NOT be included in the capacity calculations * Sample pathway as described in the draft NHS standard specification template for adult systemic anti-cancer therapy services, December 2012. https://www.engage.england.nhs.uk/consultation/ssc-area-b/supporting_documents/b3lservicespec.pdf Accessed January 2015 NEXT For current service specification refer to NHS England Chemotherapy CRG webpage. http://www.england.nhs.uk/commissioning/spec-services/npc-crg/group-b/b15/ PREVIOUS Acessed January 2015 Grey boxes indicate which capacities have been calculated. The totals on the Pharmacy , Nurse and Chair Capacity worksheets are summarised here.
Sheet 9 Results Table RESULTS TABLE NEXT PREVIOUS Enter the Title of the New Chemotherapy Regimen Staff Resource (WTE days) Isolator Time (days) Chair Time (days) Isolator and chair time in days is calculated on the basis of 7.5 hours per day. Staff time in days is based on WTE 109 68 N/A PHARMACY 86 N/A N/A NURSE 176 N/A N/A FACILITIES 194 68 176 TOTAL WTE = Whole Time Equivalent Click here to change the number of hours that constitute WTE The results are tabulated on this worksheet. No inputs are required.
Sheet 10 Local Assumptions Functionality LOCAL ASSUMPTIONS NEXT PREVIOUS To change the number of hours that the chemotherapy unit is open, input the number of hours manually into the white box. Available time (hours) 7.5 Average opening time for chemotherapy unit Average opening time for pharmacy unit 7.5 To change how long the chemotherapy unit is open or the WTE enter the new values in the appropriate white box. Fixed time for pharmacy staff Assistants Pharmacists Technicians 27.3 27.3 27.3 Time available for performing fixed time tasks. For details of the actual times used in the fixed time calculations, refer to the Pharmacy References page. Fixed time for chemotherapy nursing staff Chemotherapy-trained nurse 27.3 Fixed time for oncology clinic staff Nurses Oncologists 27.3 27.3 WTE calculations 1 whole time equivalent is 37.5 hours per week (or 2250 mins per week) Deduct 40 mins per day (2X20 min breaks) (-200 mins/week) Deduct 20% for holidays, sickness, training etc. 1 WTE =27.3 hrs/week or 5.4 hours per day To change the WTE, input the number of hours/day manually into the white box. 5.4 Whole Time Equivalent (WTE) Change hours worked / day This sheet shows the information on the local assumptions that are used in the Capacity Calculator tool. The assumptions currently used are derived from the data that has been provided by the Newcastle Cancer Centre.
Sheet 11 Pharmacy references GUIDANCE ON FIXED TIMES FOR PHARMACY* NEXT Time taken per infusion (mins) Task Clinical Check Workhseet & labels Setting Up Checking Ingredients Transfer Labelling, Final Check, Release Delivery TOTAL (mins) Assistant Technician Pharmacist 5 Total 5 10 5 2 5 5 2 34 PREVIOUS 10 5 2 5 5 2 12 12 10 Time taken per syringe (mins) Task Clinical Check Worksheet & labels Setting Up Checking Ingredients Transfer Labelling, Final Check, Release Delivery TOTAL (mins) Assistant Technician Pharmacist 4 Total 4 6 4 2 4 2 2 24 Input numbers into the white boxes to change the fixed times used in the pharmacy capacity calculations. 6 4 2 4 2 2 10 8 6 Time taken per ready made item (mins) Task Release Dispensing & labelling Final Check TOTAL (mins) Assistant Technician Pharmacist 5 Total 5 5 5 15 5 5 10 5 0 Time taken per oral drug (mins) Task Dispensing & Labelling Final Check TOTAL (mins) Assistant Technician 7 Pharmacist Total 7 3 10 3 3 0 7 Isolator cleaning time (mins) Task Initial Clean of Isolator Final Clean of Isolator Environmental Monitoring TOTAL (mins) *The data shown above has been collated by Steve Williamson, Consultant Cancer Pharmacist , Northumbria Healthcare / Cumbria, Northumberland, Tyne & Wear Area Team, NHS England Assistant Technician 15 22 Pharmacist Total 15 22 15 52 15 15 37 0 This sheet gives details of the aseptic preparation fixed times used in the pharmacy capacity calculations. The times that are currently in the tool are derived from the data that has been provided by the Newcastle Cancer Centre. If local data needs to be used, the data in the white boxes can be changed manually.
Sheet 12 Activity Tariffs UNBUNDLED HRGs FOR CHEMOTHERAPY DELIVERY FOR REGIMENS ON THE NATIONAL LIST* This sheet generates the likely tariff costs for delivering unbundled HRGs for chemotherapy delivery for regimens on the national list. If the chemotherapy regimen being delivered is not on the national list, this sheet will not apply and please use code SB17Z and local tariff information. NEXT PREVIOUS All oral regimen - Tariff for cohort HRG4 Code Go to Step 2 Total tariff for cohort ( ) Go to Step 2 Is the regimen exclusively oral chemotherapy? Step 1 No PREVIOUS No If yes, the following steps do not apply Parenteral -Tariff for Cycle 1 cohort Please select only one Yes Tariff for cycle one for cohort ( ) 2,385 Select "Yes" or "No" using the drop-down buttons Is Cycle 1 simple parenteral chemotherapy? Step 2 SB12Z Yes Tariff for cycle one for cohort ( ) Go to Step 4 Is Cycle 1 complex parenteral chemotherapy? Step 3 Go to Step 4 No Click here for details of HRG costs Tariff for cycle one for cohort ( ) No Is Cycle 1 complex parenteral chemotherapy, including prolonged infusion treatment at first attendance? Go to Results Go to Results Step 4 Parenteral -Tariff for subsequent cycles for cohort Cost for delivering subsequent cycles of chemotherapy (SB15Z) 42,660 Results Total national activity tariff for cohort (all cycles) 45,045 *National tariff payment system 2014/15, Annex 5A national prices. https://www.gov.uk/government/publications/national-tariff-payment-system-2014-to-2015 Accessed January 2015 VARIABLE TARIFF CALCULATOR Total cycles of chemotherapy for cohort 150 Chemotherapy preparation tariff 0 NEXT NEXT PREVIOUS Total variable tariff for the cohort ( ) 0 This sheet shows the likely tariff costs for delivery of the new chemotherapy regimen.
Sheet 12 Activity Tariffs Functionality UNBUNDLED HRGs FOR CHEMOTHERAPY DELIVERY FOR REGIMENS ON THE NATIONAL LIST* This sheet generates the likely tariff costs for delivering unbundled HRGs for chemotherapy delivery for regimens on the national list. If the chemotherapy regimen being delivered is not on the national list, this sheet will not apply and please use code SB17Z and local tariff information. NEXT Select Yes in Step 1 if the new regimen is comprised totally of oral drugs. PREVIOUS All oral regimen - Tariff for cohort HRG4 Code Go to Step 2 Total tariff for cohort ( ) Go to Step 2 Is the regimen exclusively oral chemotherapy? Step 1 No PREVIOUS No If yes, the following steps do not apply Parenteral -Tariff for Cycle 1 cohort Please select only one Yes Tariff for cycle one for cohort ( ) 2,385 Select "Yes" or "No" using the drop-down buttons Is Cycle 1 simple parenteral chemotherapy? Step 2 SB12Z Yes Use hyperlink to review national tariff Information. Tariff for cycle one for cohort ( ) Go to Step 4 Is Cycle 1 complex parenteral chemotherapy? Step 3 Go to Step 4 No Click here for details of HRG costs Tariff for cycle one for cohort ( ) No Is Cycle 1 complex parenteral chemotherapy, including prolonged infusion treatment at first attendance? Go to Results Go to Results Step 4 For parenteral drugs select Yes once in this section. Parenteral -Tariff for subsequent cycles for cohort Cost for delivering subsequent cycles of chemotherapy (SB15Z) 42,660 Results Total national activity tariff for cohort (all cycles) 45,045 *National tariff payment system 2014/15, Annex 5A national prices. https://www.gov.uk/government/publications/national-tariff-payment-system-2014-to-2015 Use this section of the worksheet for activities that are not on the national tariff list. Manually input the tariff in the white box. Accessed January 2015 VARIABLE TARIFF CALCULATOR Total cycles of chemotherapy for cohort 150 Chemotherapy preparation tariff 0 NEXT NEXT PREVIOUS Total variable tariff for the cohort ( ) 0
Sheet 13 Tariff Information DETAILS OF CHEMOTHERAPY COSTS (from the National tariff payment system 2014/15 - Annex 5A Spreadsheet) PREVIOUS HRG code SB11Z SB12Z SB13Z SB14Z SB15Z SB17Z HRG name Tariff ( ) 126 159 316 475 316 - Deliver Exclusively Oral Chemotherapy Deliver Simple Parenteral Chemotherapy at first attendance Deliver more Complex Parenteral Chemotherapy at first attendance Deliver Complex Chemotherapy, including Prolonged Infusion Treatment at first attendance Deliver Subsequent Elements of a Chemotherapy Cycle Deliver Chemotherapy for Regimens not on the National List National tariff payment system 2014/15, Annex 5A national prices. https://www.gov.uk/government/publications/national-tariff-payment-system-2014-to-2015 Accessed January 2015 The 2014-15 national tariffs for chemotherapy delivery are on the Excel worksheet labelled 04. Unbundled Services and are in table 2 Unbundled chemotherapy delivery Details of the HRG codes and tariff costs used in the calculation of the activity tariffs are given on this sheet. The reference is also provided.


")
")