Natural Selection Mouse Lab: Understanding Species Changes Over Time
In this natural selection mouse lab, students investigate how species evolve over time by simulating genetic variations and environmental influences. By manipulating allele cards and event cards, students observe how different color variations of mice fare in white and brown sand environments. The lab follows specific procedures to record data over multiple generations, providing insights into the mechanisms of natural selection and adaptation.
Download Presentation

Please find below an Image/Link to download the presentation.
The content on the website is provided AS IS for your information and personal use only. It may not be sold, licensed, or shared on other websites without obtaining consent from the author. Download presentation by click this link. If you encounter any issues during the download, it is possible that the publisher has removed the file from their server.
E N D
Presentation Transcript
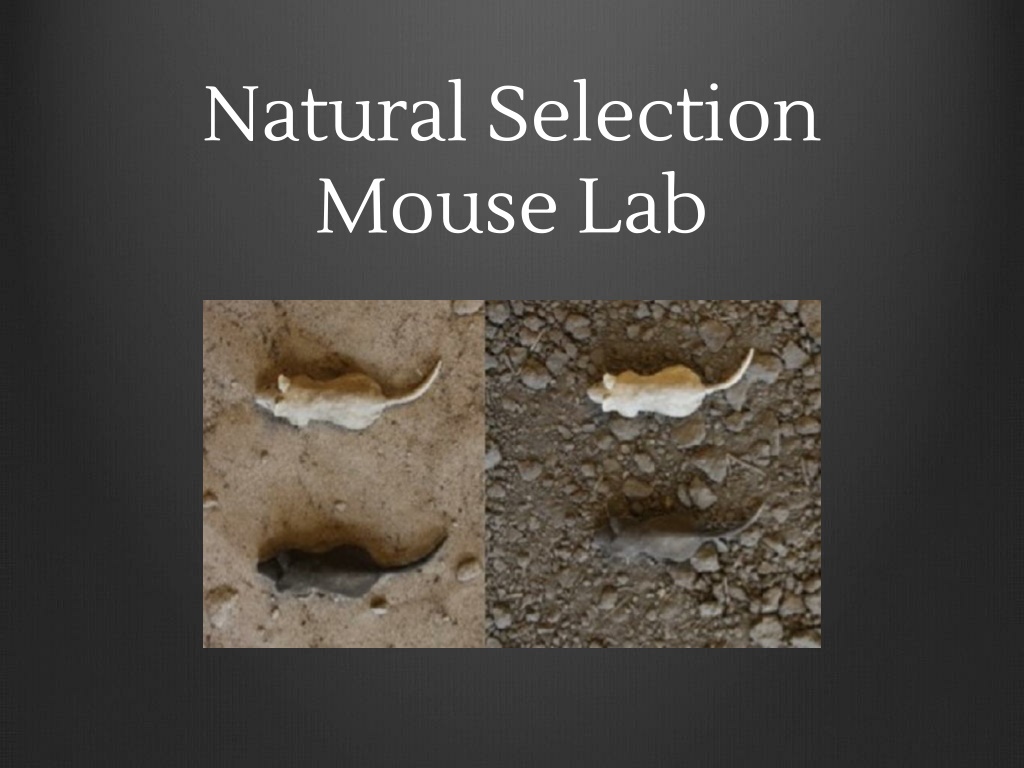
Natural Selection Mouse Lab
Problem How do species change over time?
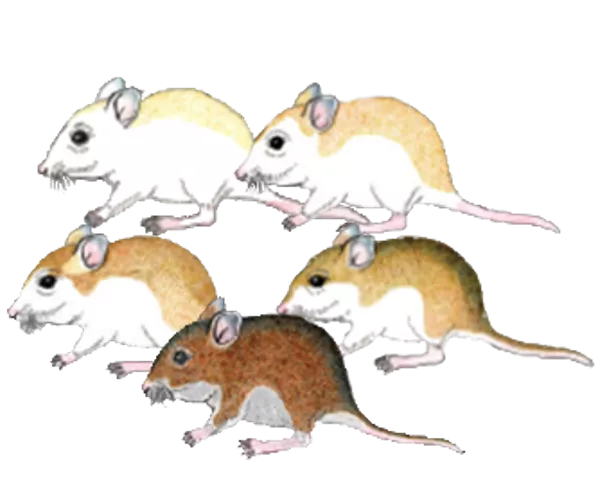
Hypothesis State what will happen to each color variation of mice in both the white and brown sand environments and support why this is the case.
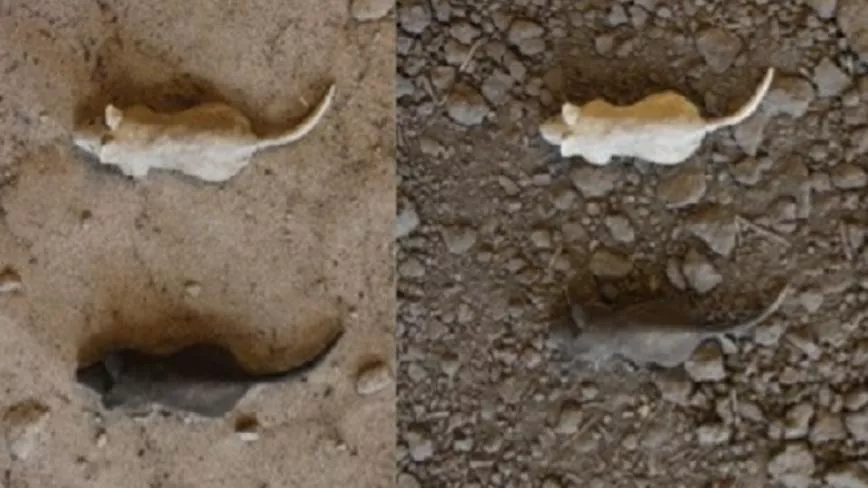
Materials W allele cards (30) Dominant allele for white fur 1. w allele cards (30) Recessive allele for brown fur 2. S event cards (10) Mouse survives 3. D event cards (1) Mouse is killed by disease 4. P event cards (1) Mouse killed by predator 5. C event cards (18) Mouse killed by predator if it contrasts with the environment ( Ex. If mouse is white on brown background or if mouse is brown on white background it is killed) 6. Live mice card (1) 7. Dead mice card (1) 8. Two Mice (one brown, one white) 9. 10. Two sandy backgrounds (one brown, one white)
Procedures 1.Mix up the W allele and w allele cards face down on the table to make a mouse pile. 2. Shuffle the event cards and put them in one event pile. 3. Choose two allele cards from the mouse pile and determine its phenotype either white or brown). 4. Choose one event card. 5. If the mouse lives put the mouse allele cards on the live mouse card.
Procedures 6. If the mouse dies put the mouse allele cards on the dead mouse card. 7. Return event card to the bottom of the event pile. 8. Repeat steps 3-7 until the allele cards are gone. 9. Record your results in the 1stgeneration of your data table. 10. Leave the dead mouse allele cards untouched. 11. Mix the remaining live mouse allele cards face down on the table to make a new mouse pile.
Procedures 12. Choose two mouse allele cards and one event card. 13. If the mouse lives put the mouse allele cards on the live mouse card, and it the mouse dies put the mouse allele cards on the dead mouse card. 14. Repeat until the mouse allele cards are gone and record data in the 2ndgeneration of the data table. 15. Repeat steps 11-14 once more but record those results in the 3rdgeneration of the data table.
Procedures 16. If you have enough mice to complete a 4th generation then do so. 17. Begin experiment again using all the mouse allele cards and the event cards for generations living on brown sand. Make sure to mix all cards before the beginning of the experiment.
Lab Table Organization W allele and w allele cards scattered face down Live Mice Shuffled event cards in pile, face down Dead Mice
Data Tables Surviving White Mice Surviving Brown Mice Death White Mice Death White Sand Brown Mice Generation 1 Generation 2 Generation 3 Generation 4 Surviving White Mice Surviving Brown Mice Death White Mice Death Brown Sand Brown Mice Generation 1 Generation 2 Generation 3 Generation 4
Sample Graph Population of Mice in a White Sand Environment over Four Generations Survival/Death Rate (# of Mice) 25 20 White Mice Alive 15 Brown Mice Alive 10 White Mice Dead Brown Mice Dead 5 0 1 2 3 4 Generation
Analysis Calculate in Part 1, how many white mice and brown mice there were in each generation. If the events in Part 1 occurred in nature, predict how the group of mice would change over time. How did the results in Part 2 differ from those in Part 1? How would it affect the data if you increased or decreased the number of C cards? What are some ways this lab investigation models natural selection? What are some ways in which natural selection differs from this model?
Conclusion Restate the purpose. Restate the hypothesis. Describe whether the data supported or did not support the hypothesis. Describe any errors that may have taken place and any things that would be changed if repeated. Based on what was learned, make suggestions for future experiments to be performed.
