Molson Coors (TAP) and Kroger (KR) Stock Analysis
Molson Coors (TAP) shows potential for growth despite volume declines, with an undervalued stock price and promising product mix. Kroger (KR) faces disruption from Amazon's Whole Foods purchase but retains market share in the U.S. grocery industry. TAP highlights include absolute and relative valuations, key takeaways, and growth strategies, while KR focuses on downside risk and competition with hard-discounters. Both companies have unique challenges and opportunities in their respective markets.
Download Presentation

Please find below an Image/Link to download the presentation.
The content on the website is provided AS IS for your information and personal use only. It may not be sold, licensed, or shared on other websites without obtaining consent from the author.If you encounter any issues during the download, it is possible that the publisher has removed the file from their server.
You are allowed to download the files provided on this website for personal or commercial use, subject to the condition that they are used lawfully. All files are the property of their respective owners.
The content on the website is provided AS IS for your information and personal use only. It may not be sold, licensed, or shared on other websites without obtaining consent from the author.
E N D
Presentation Transcript
Molson Coors (TAP): Overview Despite low single-digit volume decline (worldwide beer consumption down), current price reflects an overreaction to book value. Growing profitable product mix and overall market share, TAP s price currently offers an attractive entry point. Earnings Call, TAP misses guidance one time headwinds: European tax hit, new systems integration. TAP vs BUD * Despite larger volume declines, BUD has not seen the same price erosion.
Molson Coors (TAP): Absolute Valuation Layering in tepid growth expectations (1-2%) and 50% achievement of cost synergies, creates a base case and estimated value of $87.57 up from $69.82, offering strong BUY potential with 25% upside. Reflect values close to current price Current Price Implied equity value/share Upside/(Downside) to DCF $ 69.82 Monday, July 9th 2018 $ 87.57 25.4% $ 69.82 < Current Value $ 87.69 8% 8.5% 9.0% 9.5% 10.0% 10.5% 11.0% 11.5% 13% 1.0% $ 84.38 $ 80.15 $ 76.52 $ 73.39 $ 70.66 $ 68.28 $ 66.18 $ 64.32 $ 61.21 1.5% $ 87.59 $ 82.81 $ 78.76 $ 75.28 $ 72.27 $ 69.66 $ 67.38 $ 65.37 $ 62.01 2.0% $ 91.32 $ 85.88 $ 81.31 $ 77.42 $ 74.09 $ 71.21 $ 68.71 $ 66.52 $ 62.88 2.5% $ 95.74 $ 89.47 $ 84.26 $ 79.87 $ 76.15 $ 72.96 $ 70.20 $ 67.80 $ 63.84 3.0% $ 101.03 $ 93.70 $ 87.69 $ 82.70 $ 78.50 $ 74.93 $ 71.87 $ 69.22 $ 64.91 3.5% $ 107.51 $ 98.78 $ 91.76 $ 86.00 $ 81.22 $ 77.19 $ 73.77 $ 70.83 $ 66.09 4.0% $ 115.60 $ 104.99 $ 96.63 $ 89.90 $ 84.38 $ 79.80 $ 75.94 $ 72.65 $ 67.41
Molson Coors (TAP): Relative Valuation * TAP (which historical trades at 18x PE), is trading well below competition on a relative basis.
Molson Coors (TAP): Key Takeaways Above premium sales continue strong growth rates, which partially help to offset volume loss (product mix), demanding higher prices volumes should stabilize regardless. Molson Coors maintains its 2018 guidance for growth and $210M in annual cost synergies over the next 3 years. Molson Coors is engaged in discussions to acquire/partner with cannabis companies in Canada and has recently acquired Kombucha to add non-alcoholic products to its offering. Molson Coors has come up just short as of late against its guidance. Much of this has been the result of an effort to clean up its balance sheet and drive down debt from its 2016 acquisition of Miller Coors ( $12B) Molson Coors completed its acquisition of Miller Coors adding significant scale and valuable brands. People will always drink beer this is supported by 10,000 s of year of human history in other words, downside minimal, upside large.
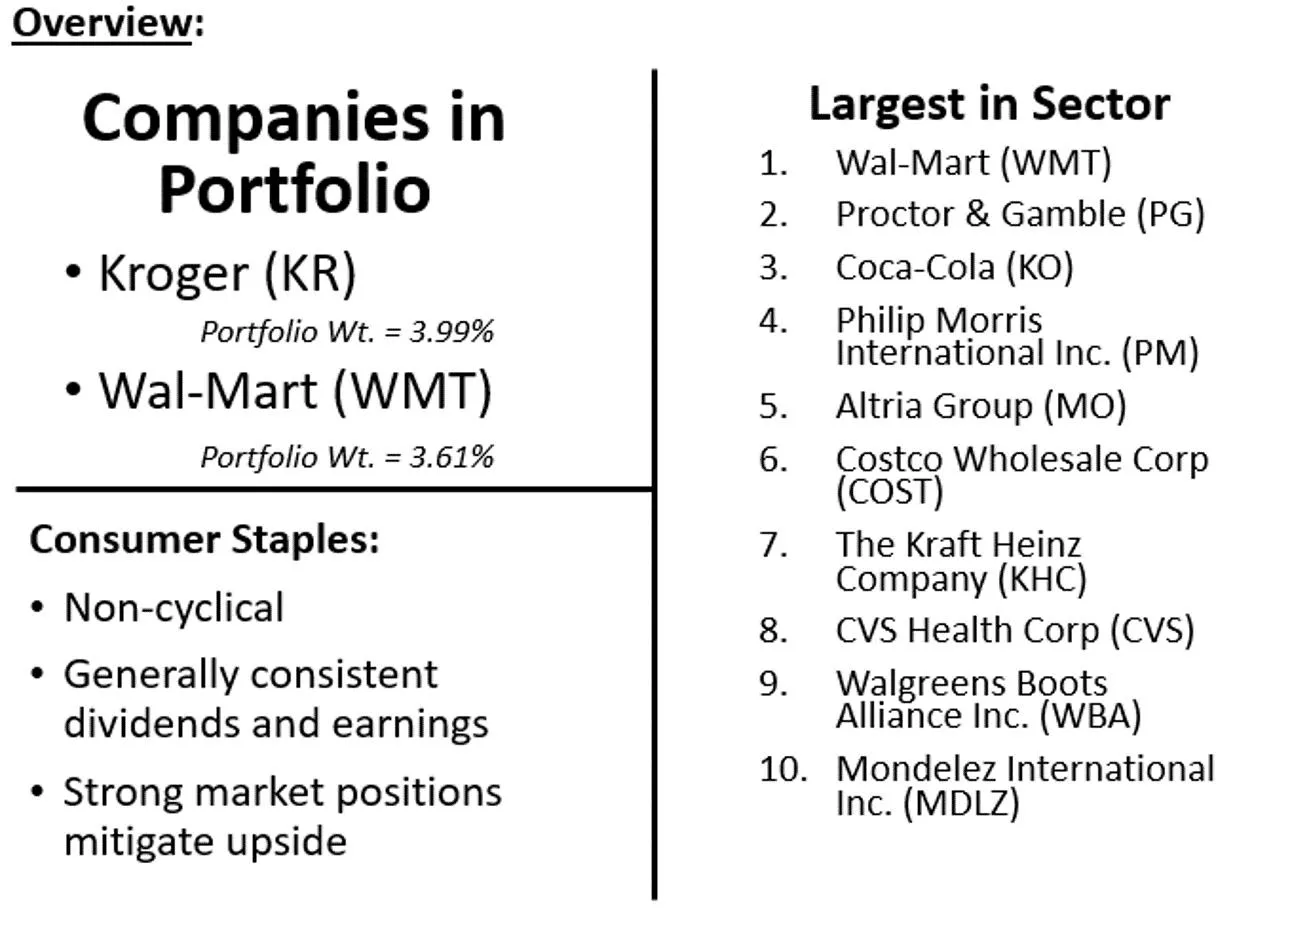
Kroger (KR) Kroger (KR) Rating: Sell Target: $27.50 Current: $29.33 Downside: 6% Amazon announces Whole Foods purchase
Kroger (KR) Kroger (KR) Amazon reaction was overblown but disruption looms U.S. Grocery Market Share (% of U.S. Food and Grocery Sales) Walmart 14.5% Kroger 7.7% Hard-discounters (Walmart, Target, Costco) have product diversification advantage Albertsons 4.5% Southeastern Grocers 3.9% Ahold Delhaize 3.2% Costco 2.4% Publix 2.3% Target 2.1% Restock Kroger - expensive initiative to maintain current market share; little growth HEB 1.7% Whole Foods 1.2% Dollar General 1.2% Supervalu 1.1% Seven & I Holdings 1.1% Amazon 0.2%
Kroger (KR) Kroger (KR) Kroger s story: margins Inflation concerns can t pass costs onto consumers Extreme industry competition Increasing capex to respond to online shopping threats
Walmart (WMT) Walmart (WMT) Walmart started out small, with a single discount store and the idea of selling more for less. Over the last 50 years it has seen itself grow into the largest retailer in the world. Approximately 270 million customers visit over 11,000 of their stores, worldwide, every week. It employs over 2.3 million people all over the world and they continue to be a leader in sustainability, corporate philanthropy and employment opportunity. Walmart s Business Segments Annual Net Sales Worldwide : 2008-2018
Walmart (WMT) Walmart (WMT) 10 year performance 10 year performance compared to S&P 500
Walmart (WMT) Walmart (WMT) Recommendation: Rating: BUY Current Share Price: $84.41 Target Share Price: $99.42 Upside: 17.8% Risks: Walmart could face stiff competition from discounters like Aldi sand also from other stores such as Kroger. On the e-commerce front, Walmart faces strong competition from Amazon, especially after Amazon s acquisition of Whole Foods Due to its global presence, the company is exposed to risks such as foreign currency movements, politics, trade wars and so on.
WMT 9.3% 3.0% Analyst: Ranjoy Choudhuri 6/5/2018 Terminal Discount Rate = Terminal FCF Growth = Year 2018 2019E 2020E 2021E 2022E 2023E 2024E 2025E 2026E 2027E 2028E 2029E 500,343 514,928 530,238 540,751 554,270 568,126 582,330 596,888 611,810 627,105 642,783 658,852 Revenue % Growth 2.9% 3.0% 2.0% 2.5% 2.5% 2.5% 2.5% 2.5% 2.5% 2.5% 2.5% Operating Income Operating Margin 20,437 21,560 22,158 23,766 24,942 25,566 26,205 26,860 27,531 28,220 28,925 29,648 4.1% 4.2% 4.2% 4.4% 4.5% 4.5% 4.5% 4.5% 4.5% 4.5% 4.5% 4.5% 958 0.2% (2,575) (2,651) (2,704) (1,109) (1,136) (1,165) (1,194) (1,224) (1,254) (1,286) (1,318) Interest and Other Interest % of Sales -0.5% -0.5% -0.5% -0.2% -0.2% -0.2% -0.2% -0.2% -0.2% -0.2% -0.2% 4,096 30.4% 4,600 21.0% 4,096 21.0% 4,423 21.0% 5,005 21.0% 5,130 21.0% 5,258 21.0% 5,390 21.0% 5,525 21.0% 5,663 21.0% 5,804 21.0% 5,949 21.0% Taxes Tax Rate Net Income % Growth 9,862 14,298 45.0% 14,710 15,939 18,829 18.1% 19,299 19,782 20,276 20,783 21,303 21,835 22,381 2.9% 8.4% 2.5% 2.5% 2.5% 2.5% 2.5% 2.5% 2.5% 10,529 10,500 10,605 10,815 11,085 11,363 11,647 11,938 12,236 12,542 12,856 13,177 Add Depreciation/Amort % of Sales Plus/(minus) Changes WC % of Sales Subtract Cap Ex Capex % of sales 2.1% 2.0% 730 0.1% 9,500 1.8% 2.0% 2.0% 2.0% 554 0.1% 9,977 1.8% 2.0% 568 0.1% 2.0% 582 0.1% 2.0% 597 0.1% 2.0% 612 0.1% 2.0% 627 0.1% 2.0% 643 0.1% 2.0% 659 0.1% 4,143 0.8% 9,673 1.9% 1,779 0.3% 9,544 1.8% 1,877 0.3% 9,734 1.8% 10,226 10,482 10,744 11,013 11,288 11,570 11,859 1.8% 1.8% 1.8% 1.8% 1.8% 1.8% 1.8% Free Cash Flow % Growth 14,861 16,029 17,550 18,897 20,491 21,004 21,529 22,067 22,619 23,184 23,764 24,358 7.9% 9.5% 7.7% 8.4% 2.5% 2.5% 2.5% 2.5% 2.5% 2.5% 2.5% 45% 55% 100% NPV of Cash Flows NPV of terminal value Projected Equity Value Free Cash Flow Yield 133,541 165,722 299,263 6.31% Terminal Value 401,416 Free Cash Yield 6.07% Current P/E Projected P/E Current EV/EBITDA Projected EV/EBITDA 17.8 20.9 8.9 10.3 17.3 20.3 8.7 10.1 15.9 18.8 8.2 9.5 Terminal P/E 17.9 Terminal EV/EBITDA 10.1 Shares Outstanding 3,010 Current Price Implied equity value/share Upside/(Downside) to DCF $ $ 84.41 99.42 17.8%
To Consider: To Consider: PepsiCo, Inc. PepsiCo, Inc. This company outperformed the S&P 500 during the 08 financial crisis. It had a dividend yield of 3.39% Currently trading 12% below its 52 week high
To Consider: To Consider: Colgate Colgate - - Palmolive Palmolive Lot of discussion around startups selling direct to consumer brushes and toothpaste; none profitable 12% under historical P/E, 16% off 52-week high
To Consider To Consider: : Proctor & Gamble Proctor & Gamble Strategic brand consolidation positions PG well for volume growth and cost synergies. Trading at $78, 3.62% Forward Dividend Yield. Estimated value $91.88 , which creates a potential for 18% upside. Current Price $ 78.11 Monday, July 9th 2018 Implied equity value/share Upside/(Downside) to DCF $ 91.88 17.6%


