Misuse of Standardization in Meta-Analysis
In meta-analysis, standardization plays a crucial role in combining mean effects from different studies. However, using standardization improperly can lead to biased results and misinterpretations. This article delves into the problems with standardization, alternatives for meta-analyzing mean effects, and recommendations for better practices.
Download Presentation

Please find below an Image/Link to download the presentation.
The content on the website is provided AS IS for your information and personal use only. It may not be sold, licensed, or shared on other websites without obtaining consent from the author.If you encounter any issues during the download, it is possible that the publisher has removed the file from their server.
You are allowed to download the files provided on this website for personal or commercial use, subject to the condition that they are used lawfully. All files are the property of their respective owners.
The content on the website is provided AS IS for your information and personal use only. It may not be sold, licensed, or shared on other websites without obtaining consent from the author.
E N D
Presentation Transcript
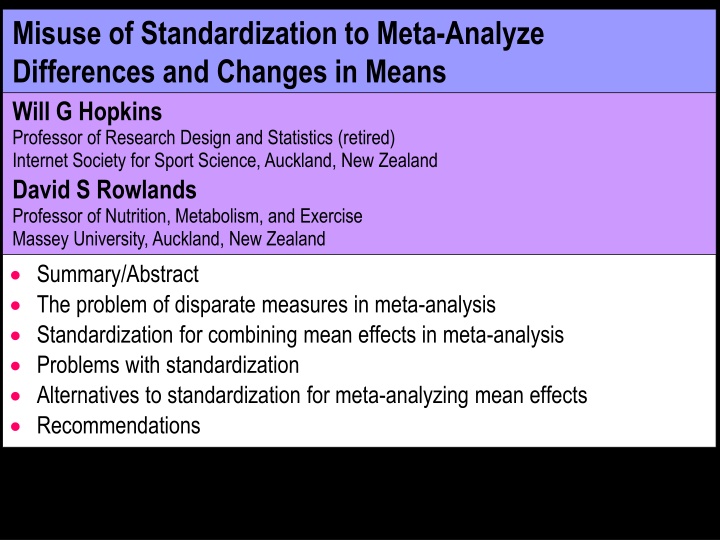
Misuse of Standardization to Meta-Analyze Differences and Changes in Means Will G Hopkins Professor of Research Design and Statistics (retired) Internet Society for Sport Science, Auckland, New Zealand David S Rowlands Professor of Nutrition, Metabolism, and Exercise Massey University, Auckland, New Zealand Summary/Abstract The problem of disparate measures in meta-analysis Standardization for combining mean effects in meta-analysis Problems with standardization Alternatives to standardization for meta-analyzing mean effects Recommendations
Summary/Abstract In a meta-analysis, disparate effects from different studies are expressed in the same units and scaling to allow combining them into estimates of the average effect, the heterogeneity, and their uncertainties. When the effects are differences or changes in the mean of a continuous measure, meta-analysts often use standardization to combine disparate effects as standardized mean differences (SMDs). An SMD is properly calculated as the difference in means divided by a between-subject reference or pre-intervention standard deviation (SD). When combining mean effects from controlled trials and crossovers, most meta-analysts divide instead by other SDs, especially SDs of change scores, resulting in biased SMDs without a clinical or practical interpretation. Whichever SD you use, it adds non-biological heterogeneity to the SMD. There are better ways to combine disparate mean effects for meta-analysis: express as percent or factor effects and combine via log transformation; combine psychometrics by rescaling to percent of maximum range; combine effects divided by their minimum important differences (MIDs). In the absence of MIDs, assess the magnitudes of a mean effect in different settings by calculating SMDs with the SDs in those settings after meta-analysis.
The problem of disparate measures in meta-analysis Example: the effects of an intervention on time-trial time, distance, speed or power output in running, cycling and rowing tests ranging in duration from ~1 min to ~1 h. You'd like to summarize the meta-analysis with a forest plot: Study 1 Study 2 Study 3 Study 4 Study 5 Study 6 Study 7 Data are means and confidence intervals Study 8 Prediction interval (uncertainty in a new setting, due partly to heterogeneity) Study 9 Study 10 Mean harmful trivial beneficial Effect on performance (units) The plot makes sense only if the effects all have the same units and scaling. But converting all effects to change in time (s), distance (m), speed (m/s) or power (W) doesn't work for different durations and/or exercise modes.
Standardization for combining mean effects in meta-analysis Standardization of the effects is one solution to disparate measures. The standardized mean difference (SMD) = mean SD, where mean is the difference or change in the mean, and SD = an appropriate between-subject standard deviation. The SMD was devised by Jacob Cohen, hence Cohen's d. Gene Glass suggested use of the SMD for meta-analysis. The numerator and denominator of the SMD have the same units. Hence the units cancel out to make the SMD dimensionless. For linear transformations between units (i.e., add and/or multiply by a constant), mean SD has the same value: meanY SDY = k. meanX k.SDX = meanX SDX. Even for non-linear transformations (e.g., power = k.speed3 in rowing), mean SD has practically the same value, when mean and SD are sufficiently small (<10% of the mean): If Y = f(X), then meanY f (X). meanX, and SDY f (X).SDX Hence meanY SDY f (X). meanX f (X).SDX = meanX SDX.
The SMD captures the notion that the magnitude of the difference in means should be interpreted according to the overlap of the two distributions of the values. Example: IQs of females and males females Substantial effect Negligible effect males males females IQ IQ But which SD should be used, males' or females'? For a simple comparison of means, use the SD of the "reference" group. Example: IQ of females and males = 105 15 and 100 20. The SMD for females referenced to males = (105-100)/20 = 0.25. The SMD for males referenced to females = (100-105)/15 = -0.33. Averaging the SMD is equivalent to using the harmonic mean of the SDs. The usual mean of the SDs or (mean of SD2) would be wrong.
If the SMD is for a change in the mean (in a time series or crossover) or for a difference in the changes in the mean (in a controlled trial), SDs of post- intervention scores and SDs of change scores become available. In our survey of 80 recent meta-analyses in three medical journals about one-third (35%) of the meta-analyses used SMDs; two-fifths (39%) of the 35% used change-score SDs for the SMDs; many (66%) of the 35% "pooled" pre- and post-intervention SDs or pooled change-score SDs in the control and intervention groups; only one-tenth (12%) of the 35% pooled the pre-intervention SDs. The next slide illustrates some of these SMDs for the effect of an intervention on VO2max, simulated with a spreadsheet. !
If the SMD is for a change in the mean (in a time series or crossover) or for a difference in the changes in the mean (in a controlled trial), SDs of post- intervention scores and SDs of change scores become available. In our survey of 80 recent meta-analyses in three medical journals about one-third (35%) of the meta-analyses used SMDs; two-fifths (39%) of the 35% used change-score SDs for the SMDs; many (66%) of the 35% "pooled" pre- and post-intervention SDs or pooled change-score SDs in the control and intervention groups; only one-tenth (12%) of the 35% pooled the pre-intervention SDs. Why is using the change-score SD wrong? The change-score SD is a combination of individual responses and random standard error of measurement: SD = (SDIR2 + 2SEM2) If SDIR predominates or the contribution of SEM is removed, the SMD would be huge when SDIR is negligible. If SEM predominates or the contribution of SDIR is removed, the SMD would be huge for very precise measurements. In either scenario, the SMD does not capture the biological importance of the intervention, and it can be absurdly biased. !
Why is pooling the pre- and post-intervention SDs or post-intervention SDs in the control and intervention groups wrong? There is an unknown contribution of SDIR and SEM to the SMD. Why is pooling the pre-intervention SDs in the two groups correct? First, pooling just estimates the population SD before the intervention. Equally, you can use the SD of all subjects at baseline. It's equivalent to the reference-group SD for assessing a mean difference. Example: give males hormones to make them more like females. The treated males want to know how much they differ from other males. So assess the mean change just as you would the mean difference. Here's another reason: for clinically important measures, differences between individuals are associated with health outcomes. Hence it is worth trying an intervention to change the measure, from a low value to a high value, say. But "low" and "high" are determined by the SD of the measure. Hence the bigger the mean change relative to the pre-intervention SD, the more clinically important is the intervention. SEM should be removed from the SD. (No previous authors noted this!)
Why are so many meta-analysts getting it wrong? Publications using the wrong SD are in the majority. So, it's easy to cite a previous publication using the wrong SD. And "if it's been accepted for publication, it must be OK." Even Jacob Cohen allowed change-score SDs, without explanation. Some meta-analysts don't understand standardization. They provided no information about how they standardized. Some we contacted admitted that they didn't know which SD they used: they used their meta-analysis package blindly. And the meta-analysis packages provide no advice on which SD to use. It's simpler to use pooled change-score SDs to estimate the SMD and its SE. We had to devise a new formula for the SE with the right SD. R was most popular (38%); nearly half of these (47%) used metafor, which has many inappropriate options. Stata was the second most popular (24%). It makes no mention of whether SDs input by the user refer to raw scores or change scores. Cochrane's Revman was less popular (16%). The Handbook provides extensive documentation on deriving SD of change scores, yet elsewhere it seems to support pre-intervention SDs. Confusing!
Problems with standardization It creates additional heterogeneity. Heterogeneity is estimated in a meta-analysis by a random effect representing real differences in mean between studies. Real differences are differences not due to sampling variation. But SMD = mean SD will have non-biological (artifactual) additional heterogeneity arising from differences in SD between studies due to different populations and different biased samples of the same population. Different SDs arising only from small sample sizes add to uncertainties in the mean and heterogeneity, but do not add to the heterogeneity. The smallest and other magnitude thresholds for SMDs are arbitrary. Everyone accepts 0.2 as the smallest important difference, but even so, this is not a minimum clinically or practically important difference. Cohen suggested 0.5 and 0.8 for moderate and large. Others have argued for 0.6 and 1.2 (and 2.0 and 4.0 for very and extremely large). The thresholds make sense only for original data that are approximately normal. Hence meta-analysts should consider alternatives to SMDs for combining mean effects from studies with disparate measures.
Alternatives to standardization for meta-analyzing mean effects Meta-analyze log-transformed factor effects If a treatment enhances performance in a 20-min time trial by ~1 min, we expect the treatment to enhance performance in a 40-min trial by ~2 min. That is, we expect similar percent effects, here 1 in 20 = 2 in 40 = 5%. We also expect similar percent effects in females and males. More generally, we expect that percent effects on most physiological, biochemical and biomechanical measures that have only positive non-zero values will be uniform across different subjects, settings and scales. We also expect measurement error to be uniform in percent units, which is why it is usually expressed as a coefficient of variation. Now, percent effects and errors are really factor effects and errors: a 5% increase is a factor of 1.05: Y2 = Y1*(1 + 0.05/100) = Y1*1.05 = Y1*f. Log transformation converts uniform factor effects to uniform additive effects: Y2 = Y1*f, where Y1 and Y2 are the pre and post measurements, say; therefore log(Y2) = log(Y1*f) = log(Y1) + log(f), therefore log(Y2) log(Y1) = log(Y) = log(f), which is independent of Y1. Bonus: additive effects can be analyzed with all the usual linear models.
Logarithms of any base can be used to log transform, but 100*natural log is the most useful: a 5% effect = a factor of 1.05, and 100*log(1.05) = 4.9, i.e., the log- transformed effect is approximately the percent effect, for small percents. 1.0% 1.0, 10% 9.5, 50% 41, 100% 69, 200% 110 So effects and SDs in analyses of log-transformed data look like percents, but of course you need to back-transform them to percents or factors. Log transformation solves the meta-analyst's problem of scales differing by a multiplicative constant. Example: speed or distance in different studies of the same mode of exercise in a fixed-time time trial Speed = Distance/Time = Distance*k, where k is fixed; therefore log(Speed) = log(Distance*k) = log(Distance) + log(k), therefore log(Speed) = log(Speed2) log(Speed1) = log(Distance2) + log(k) log(Distance1) log(k) = log(Distance2) log(Distance1) = log(Distance).
Log transformation does not immediately solve the problem of scales differing by a non-linear transformation. Example: effects on endurance performance may be reported in units of time, distance, speed or power in various exercise modes. Effects on endurance power (the physiological effect) are expected to be uniform across different exercise modes. But Power = k*Speedn= k*(Distance/Time)n, where n = 1 for running, ~2.0 for swimming, ~2.2-2.4 for cycling, and 3.0 for rowing. Therefore log(Power) = log(Speedn) = (n*log(Speed)) = n* log(Speed), if speed is measured = n* log(Distance), if distance for a fixed time is measured = -n* log(Time), if time for a fixed distance is measured. So, multiply log of factor effects on speed, distance or time by the appropriate n before meta-analysis to get log of factor effects on power. But there is a problem of bias in meta-analyzed log factor effects. Most authors will have analyzed raw data to get mean, when they should have analyzed log-transformed data
In a meta-analysis, effects are weighted by the inverse of the square of the standard error (SE) of each effect. Expressing the raw SE as a factor and then log-transforming it results in larger effects getting less weight, when sample sizes are small, so the meta-analyzed mean effect is underestimated. During this study, we devised simulations of meta-analyses of differences and changes in mean effects to investigate this bias. We discovered that there is negligible bias in the mean effect and in the heterogeneity in a range of simulated meta-analyses normally encountered in biomedical settings, when the t statistic (or p value) for the raw effect is used to calculate the SE for the log-transformed factor effect. The log-transformed meta-analyzed mean and heterogeneity need to be assessed inferentially for their magnitudes using the smallest important and other magnitude thresholds expressed as log-transformed factor effects. But some measures don't have clinically or practically relevant thresholds. Example: team-sport fitness tests or match-performance indicators. For such measures, use standardization after meta-analysis
Calculate the between-subject SD as a factor (1 + RawSDRawMean), then use its log-transformed value to do the standardizing of the log- transformed effect and heterogeneity. When different studies have different reference or pre-intervention means and SDs, standardize with chosen studies (pooling those that are similar). Or use means and SDs provided by large-sample studies outside the meta-analysis. The effect could be trivial in a population with a large SD and substantial in a population with a small SD. But again, there is a bias problem The log-transformed factor SD under-estimates the true log- transformed factor SD, so the resulting SMD is over-estimated. We did not know how to derive a correction factor analytically, so we did simulations to derive it empirically. The correction factor depends on the magnitude of RawSD RawMean and the sample size. A cubic function predicts the correction factor almost perfectly.
Meta-analyze mean effects of psychometrics rescaled 0-100 For psychometric dependent variables representing perceptions, attitudes or behaviors assessed with different Likert or visual-analog scales, rescaling each to a range of 0-100 is appropriate. The common metric is then percent of maximum possible range. In the absence of clinically relevant magnitude thresholds, 10, 30, 50, 70 and 90 percent of the range seem reasonable as thresholds for small, moderate, large, very large, and extremely large. But these thresholds may be too large for psychometrics derived by combining an inventory of multiple correlated Likert items and rescaling. So, standardization after meta-analysis is the only option for psychometrics that have social relevance, but are not known to be related to health, wealth or performance. Example: some of the Big 5 dimensions of personality. Someone I know is 2SD below the mean of agreeableness!
Again, you standardize the meta-analyzed mean and heterogeneity with the rescaled reference or pre-intervention SD of chosen studies and/or studies external to the meta-analysis. But this SD consists of the true SD of the underlying construct plus the standard error of the mean of the items in the construct. This error should be removed by multiplying the observed SD by the square root of Cronbach's alpha, since Cronbach's alpha is defined as the true variance divided by the observed variance. Other things being equal, instruments with different numbers of items should then have similar SDs, and similar SDs can be pooled. But beware: when the mean of a Likert-based measure is close to the minimum or maximum possible value relative to the SD (e.g., on the 0-100 scale, mean = 15, SD = 10), the scores are obviously non-normal, so interpretation of the SMD is problematic. Meta-analyze effects rescaled with minimum important differences SMDs can be avoided by dividing mean effects by the minimum important difference rather than by an SD, then meta-analyzing.
This approach has been suggested for psychometrics that combine questionnaires and physical tests (e.g., some measures of quality of life). For each such measure, clinicians often have an agreed minimum important difference. A value of 1.0 for the meta-analyzed rescaled effect of represents the threshold for clinical importance. We suggest thresholds for the rescaled effect of 3.0, 6.0, 10 and 20 for moderate, large, very large and extremely large, reflecting the spacing of the thresholds for standardized effects. It solves all the problems of standardization for mean effects. And it's an option for combining any effects, including count, proportion and hazard ratios. But always meta-analyze these via log transformation, then assess magnitudes with minimum important differences in different settings. It was not used in any of the meta-analyses we reviewed. And in the absence of minimum important differences, you have to use standardization after meta-analysis to assess the magnitudes of a mean effect in different settings. Calculate the SMDs with the between-subject SDs in those settings.
Recommendations Meta-analysts: use standardization as a last resort to combine mean effects. Instead, log-transform factor effects (always). Rescale psychometrics 0-100 (almost always). Rescale with minimum important differences (rarely). In their absence, standardize after meta-analysis to assess magnitude. Creators of meta-analysis packages: you are partly responsible for the use of wrong SDs in meta-analyses of standardized mean effects. You should remove the options for using change-score and post-intervention SDs; provide or implement a correct formula for SEs with pre-intervention SDs; and strongly advise use of approaches other than standardization. Reviewers of manuscripts reporting meta-analyzed SMDs: you should insist on re-analysis, when the wrong SD has been used; and ensure authors provide adequate details about their methods. Consumers of a meta-analysis: if the authors used the wrong SDs try to re-assess the magnitudes before citing the meta-analysis, and before acting on it, use the meta-analysis to identify studies relevant to your setting, then evaluate those studies yourself.
