Missing Data

Katie Tenney & Connor Lubsen
Missing Data
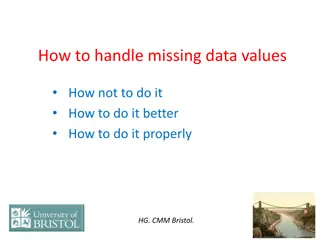
What it is and how to deal with it
Outline
Step 1: Identify
reason for
missing data
•
Potential reasons for missing data:
o
Respondent refusal/Non-response
Either passive (benign) or active (problem)
o
Random data collection issues
e.g., lack of available data cross-section
o
Attrition due to social/natural processes
e.g., aging out of a school survey
o
Intentional missing as part of data collection process
Having an idea
why
data are missing can give us a
better idea of how to fix the problem.
Step 2:
Evaluate the
type of
"missingness"
•
Certain analysis methods assume a certain
probability distribution. There are three
main categories to identify:
1.
Missing Completely at Random (MCAR)
Missing value (y) neither depends on x nor y
2.
Missing at Random (MAR)
Missing value (y) depends on x, but not y
3.
Missing not at Random (NMAR)
The probability of a missing value depends on the
variable that is missing
Missing Completely at Random (MCAR)
o
Data is
missing completely at random
if the missing value (y) neither depends on x nor
y; unrelated to the values, or potential values, for any of the variables in or outside of
the model.
•
i.e. if a respondent doesn't show up for an in-person survey because they were in
a car crash, or just forgot to answer the question.
•
Can be determined using a t-test
If data are MCAR, then throwing out observations with missing data will
not
bias your
estimated parameters.
However, this leaves you with fewer observations and reduces your statistical power
(because lower n) and doesn't use all information.
Missing at Random (MAR)
•
Also known as the "ignorability assumption" is where we
assume that the missing value (y) depends on x, but not y.
•
i.e. older people are less likely to report income on a
survey, but that's because they're old, not necessarily
because they have a large amount of income. Thus, the
"missingness" is related to the variable
age
, not
income
itself.
•
It is acceptable to drop the missing observations here if
the regression controls for all the variables that affect
the probability of missingness, but there are other
methods that may retain more information.
Missing Not at Random (MNAR)
•
Data can be MNAR (not ignorable (NI)) in two different ways:
1.
Missingness that depends on
unobserved predictors
.
i.e. if it depends on information that has not been recorded and this information
also predicts the missing values.
E.g.: If college educated people are less likely to report their incomes, and having
a college degree is predictive of earnings, and there is also some nonresponse
(missing values) to the education question. This would mean that earnings are
NMAR (Gelman 2007).
2.
Missingness that depends on the
missing value itself
Example: Respondents with high income less likely to report income.
Step 3: Deal
with missing
data
•
Goal: Use the best analysis strategy to yield
the least biased estimates.
o
Deletion Methods
Listwise deletion
, pairwise deletion
o
Simple Imputation Methods
Mean substitution
,
dummy variable method
,
single
regression
o
Model-Based Methods
Maximum Likelihood, multiple imputation
Simply
delete the entire row (entire
observation) from the dataset and ignore
the problem
.
Pros:
o
Easy
o
Is asymptotically unbiased if data are MCAR
o
Allows for comparability
across analyses
Cons:
o
Reduces statistical power (lower n)
o
Doesn't use all the information
o
Will cause slope estimates to be biased if
MAR or MNAR
List-wise
Deletion
(Complete
Case Analysis)
Overview
of Simple
Imputation
Methods
Pros:
o
Keep the full sample size
o
Can be advantageous for bias and precision
Cons:
o
The standard errors of estimates tend to be too low
o
We're essentially "playing God" by assuming we know
the true values with certainty
Imputation
Method #1:
Replace with
Average
Pros:
o
Easiest imputation method
o
Uses all the information
available
o
Doesn't bias if MCAR
Cons:
o
False impression of N
o
Causes standard deviation to
be underestimated
o
Distorts relationships between
variables by "pulling" estimates
of the correlation toward zero
(Gelman, 2007).
Process: Replace each missing value with the mean of the observed values
for that variable.
Imputation
Method #2:
Dummy
Variable
Approach
Cons:
•
Assumes the observations
are missing at random, which
is not always the case.
•
Yields biased coefficient
estimates for the other
variables in the model
because it forces the slope to
be the same across both
missing-data groups.
Process:
•
Create a dummy variable where the value is 0 if not missing and 1 if
missing
•
Fill in the missing values of the variable of interest with a constant value
like one or the mean.
Pros:
•
Uses all available information for
estimations
•
Able to get better estimate of slope
Imputation
Method #3:
Regression
Imputation
Pros:
o
Uses information from
observed data
o
Accounts for MAR data
Cons:
o
Overestimates model fit and correlation
estimates because regression error term is
not carried forward
o
Weakens variance
Process:
1.
Calculate the regression model using the observed variables
2.
Impute the predicted values into the missing values
3.
Calculate a second regression model including the imputed
missing values
4.
Compare regression results
Brief Description of
Multiple imputation
Basic steps:
1.
Make a model that predict every missing data item
(linear or logistic regression, non-linear models,
etc.)
2.
Use the above models to create a “complete”
dataset.
3.
Each time a “complete” dataset is created, do an
analysis of it, keeping the mean and SE of each
parameter of interest.
4.
Repeat this between 2 and tens of thousands of
times
5.
To form final inferences, for each repetition,
average across means, and sum the within and
between variances for each parameter (UCL, 2015)
Code Application
The Model:
Salary =
b
1 +
b
2•
Exper
Questions?
Appendix
Appendix
Sampling Distribution for Beta One:
*True Beta
value of 3
Citations
•
Gelman, A. and Hill, J. (2007) Ch 25: Missing-data imputation in Data Analysis
Using Regression and Multilevel/Hierarchical Models. Cambridge University Press,
New York.
•
https://www.publichealth.columbia.edu/research/population-health-
methods/missing-data-and-multiple-imputation
•
University College London. (2015). Missing data
analysis.
https://www.ucl.ac.uk/~rmjbale/Stat/13.pdf
•
Humphries, M. (date unknown). Missing Data & How to Deal: An overview of
missing data. Population Research Center.
https://minio.la.utexas.edu/webeditor-
files/prc/pdf/missing-data.pdf
Missing data is a common issue in survey methodology, affecting the validity of analysis. Learn how to identify reasons, evaluate types of missingness (MCAR, MAR, NMAR), and choose appropriate techniques for data handling and analysis. Discover strategies to address missing data effectively to ensure robust research outcomes.

Download Presentation

Please find below an Image/Link to download the presentation.
The content on the website is provided AS IS for your information and personal use only. It may not be sold, licensed, or shared on other websites without obtaining consent from the author. Download presentation by click this link. If you encounter any issues during the download, it is possible that the publisher has removed the file from their server.
E N D
Presentation Transcript
Katie Tenney & Connor Lubsen Missing Data What it is and how to deal with it
Outline Missing data is a prevalent issue most common in survey methodology, where individuals fail to answer questions for one reason or another, but it shows up in other data as well. There are three main steps in dealing with missing data: Identify potential reasons/patterns for missing data (WHY) Understand the distribution of missing data (WHAT) Decide on the best method of analysis (HOW)
Having an idea why data are missing can give us a better idea of how to fix the problem. Potential reasons for missing data: o Respondent refusal/Non-response Either passive (benign) or active (problem) Step 1: Identify reason for missing data o Random data collection issues e.g., lack of available data cross-section o Attrition due to social/natural processes e.g., aging out of a school survey o Intentional missing as part of data collection process
Certain analysis methods assume a certain probability distribution. There are three main categories to identify: Step 2: Evaluate the type of "missingness" 1. Missing Completely at Random (MCAR) Missing value (y) neither depends on x nor y 2. Missing at Random (MAR) Missing value (y) depends on x, but not y 3. Missing not at Random (NMAR) The probability of a missing value depends on the variable that is missing
Missing Completely at Random (MCAR) o Data is missing completely at random if the missing value (y) neither depends on x nor y; unrelated to the values, or potential values, for any of the variables in or outside of the model. i.e. if a respondent doesn't show up for an in-person survey because they were in a car crash, or just forgot to answer the question. Can be determined using a t-test If data are MCAR, then throwing out observations with missing data will not bias your estimated parameters. However, this leaves you with fewer observations and reduces your statistical power (because lower n) and doesn't use all information.
Missing at Random (MAR) Also known as the "ignorability assumption" is where we assume that the missing value (y) depends on x, but not y. i.e. older people are less likely to report income on a survey, but that's because they're old, not necessarily because they have a large amount of income. Thus, the "missingness" is related to the variable age, not income itself. It is acceptable to drop the missing observations here if the regression controls for all the variables that affect the probability of missingness, but there are other methods that may retain more information.
Missing Not at Random (MNAR) Data can be MNAR (not ignorable (NI)) in two different ways: 1. Missingness that depends on unobserved predictors. i.e. if it depends on information that has not been recorded and this information also predicts the missing values. E.g.: If college educated people are less likely to report their incomes, and having a college degree is predictive of earnings, and there is also some nonresponse (missing values) to the education question. This would mean that earnings are NMAR (Gelman 2007). 2. Missingness that depends on the missing value itself Example: Respondents with high income less likely to report income.
Goal: Use the best analysis strategy to yield the least biased estimates. oDeletion Methods Listwise deletion, pairwise deletion oSimple Imputation Methods Mean substitution, dummy variable method, single regression oModel-Based Methods Maximum Likelihood, multiple imputation Step 3: Deal with missing data
Simply delete the entire row (entire observation) from the dataset and ignore the problem. Pros: List-wise Deletion (Complete Case Analysis) o Easy o Is asymptotically unbiased if data are MCAR o Allows for comparability across analyses Cons: o Reduces statistical power (lower n) o Doesn't use all the information o Will cause slope estimates to be biased if MAR or MNAR
Pros: Overview of Simple Imputation Methods o Keep the full sample size o Can be advantageous for bias and precision Cons: o The standard errors of estimates tend to be too low o We're essentially "playing God" by assuming we know the true values with certainty
Process: Replace each missing value with the mean of the observed values for that variable. Imputation Method #1: Replace with Average Pros: o Easiest imputation method o Uses all the information available o Doesn't bias if MCAR Cons: o False impression of N o Causes standard deviation to be underestimated o Distorts relationships between variables by "pulling" estimates of the correlation toward zero (Gelman, 2007).
Process: Create a dummy variable where the value is 0 if not missing and 1 if missing Fill in the missing values of the variable of interest with a constant value like one or the mean. Imputation Method #2: Dummy Variable Approach Pros: Cons: Assumes the observations are missing at random, which is not always the case. Uses all available information for estimations Able to get better estimate of slope Yields biased coefficient estimates for the other variables in the model because it forces the slope to be the same across both missing-data groups.
Process: 1. Calculate the regression model using the observed variables 2. Impute the predicted values into the missing values 3. Calculate a second regression model including the imputed missing values 4. Compare regression results Imputation Method #3: Regression Imputation Cons: Pros: o Overestimates model fit and correlation estimates because regression error term is not carried forward o Weakens variance o Uses information from observed data o Accounts for MAR data
Brief Description of Multiple imputation Basic steps: 1. Make a model that predict every missing data item (linear or logistic regression, non-linear models, etc.) 2. Use the above models to create a complete dataset. 3. Each time a complete dataset is created, do an analysis of it, keeping the mean and SE of each parameter of interest. 4. Repeat this between 2 and tens of thousands of times 5. To form final inferences, for each repetition, average across means, and sum the within and between variances for each parameter (UCL, 2015)
Code Application The Model: Salary = b1 + b2 Exper No Correction List Wise Deletion Zero Order Method Dummy Variable Method Intercept NaN 6.1682 6.5249 6.7877 Beta One (Exper) NaN 0.1162 0.0930 0.0931 Beta Two (Dummy) - - - 1.5533
Sampling Distribution for Beta One: *True Beta value of 3
Citations Gelman, A. and Hill, J. (2007) Ch 25: Missing-data imputation in Data Analysis Using Regression and Multilevel/Hierarchical Models. Cambridge University Press, New York. https://www.publichealth.columbia.edu/research/population-health- methods/missing-data-and-multiple-imputation University College London. (2015). Missing data analysis. https://www.ucl.ac.uk/~rmjbale/Stat/13.pdf Humphries, M. (date unknown). Missing Data & How to Deal: An overview of missing data. Population Research Center. https://minio.la.utexas.edu/webeditor- files/prc/pdf/missing-data.pdf


")
")
")